Immigrants from Egypt vs Black/African American Median Family Income
COMPARE
Immigrants from Egypt
Black/African American
Median Family Income
Median Family Income Comparison
Immigrants from Egypt
Blacks/African Americans
$111,689
MEDIAN FAMILY INCOME
99.0/ 100
METRIC RATING
83rd/ 347
METRIC RANK
$81,912
MEDIAN FAMILY INCOME
0.0/ 100
METRIC RATING
328th/ 347
METRIC RANK
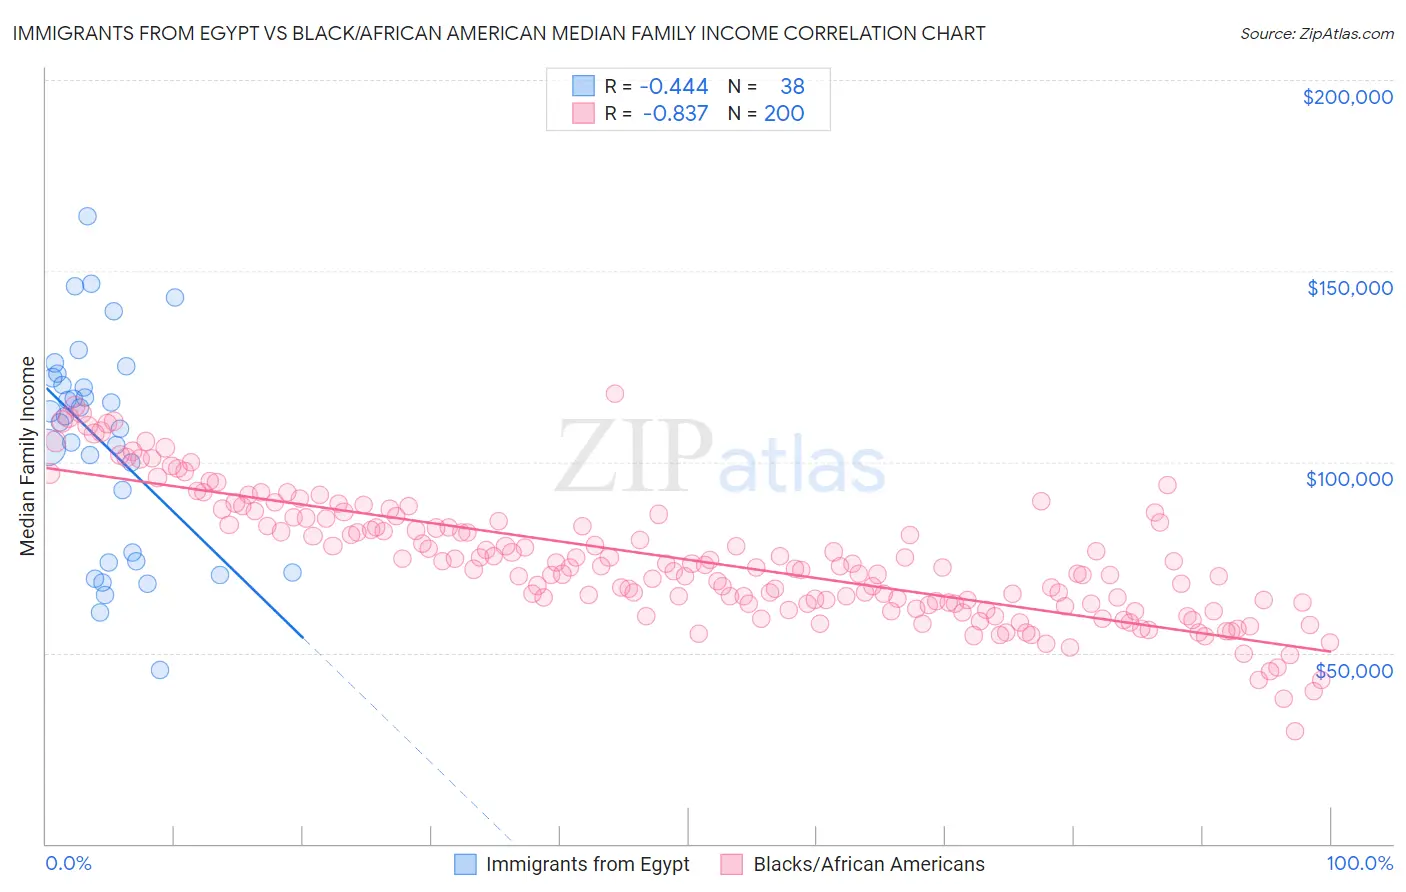
Immigrants from Egypt vs Black/African American Median Family Income Correlation Chart
The statistical analysis conducted on geographies consisting of 245,384,191 people shows a moderate negative correlation between the proportion of Immigrants from Egypt and median family income in the United States with a correlation coefficient (R) of -0.444 and weighted average of $111,689. Similarly, the statistical analysis conducted on geographies consisting of 564,544,060 people shows a very strong negative correlation between the proportion of Blacks/African Americans and median family income in the United States with a correlation coefficient (R) of -0.837 and weighted average of $81,912, a difference of 36.3%.
Median Family Income Correlation Summary
| Measurement | Immigrants from Egypt | Black/African American |
| Minimum | $45,581 | $29,315 |
| Maximum | $164,298 | $117,822 |
| Range | $118,717 | $88,507 |
| Mean | $104,674 | $74,336 |
| Median | $111,132 | $72,335 |
| Interquartile 25% (IQ1) | $74,063 | $62,832 |
| Interquartile 75% (IQ3) | $122,004 | $85,289 |
| Interquartile Range (IQR) | $47,941 | $22,457 |
| Standard Deviation (Sample) | $28,077 | $16,637 |
| Standard Deviation (Population) | $27,705 | $16,596 |
Similar Demographics by Median Family Income
Demographics Similar to Immigrants from Egypt by Median Family Income
In terms of median family income, the demographic groups most similar to Immigrants from Egypt are Immigrants from Hungary ($111,378, a difference of 0.28%), Croatian ($111,370, a difference of 0.29%), Ukrainian ($111,368, a difference of 0.29%), Immigrants from England ($112,038, a difference of 0.31%), and Austrian ($111,306, a difference of 0.34%).
| Demographics | Rating | Rank | Median Family Income |
| Argentineans | 99.4 /100 | #76 | Exceptional $112,665 |
| Immigrants | Eastern Europe | 99.4 /100 | #77 | Exceptional $112,527 |
| Immigrants | Canada | 99.3 /100 | #78 | Exceptional $112,374 |
| Italians | 99.3 /100 | #79 | Exceptional $112,372 |
| Immigrants | Croatia | 99.3 /100 | #80 | Exceptional $112,323 |
| Immigrants | North America | 99.2 /100 | #81 | Exceptional $112,151 |
| Immigrants | England | 99.2 /100 | #82 | Exceptional $112,038 |
| Immigrants | Egypt | 99.0 /100 | #83 | Exceptional $111,689 |
| Immigrants | Hungary | 98.8 /100 | #84 | Exceptional $111,378 |
| Croatians | 98.8 /100 | #85 | Exceptional $111,370 |
| Ukrainians | 98.8 /100 | #86 | Exceptional $111,368 |
| Austrians | 98.8 /100 | #87 | Exceptional $111,306 |
| Romanians | 98.8 /100 | #88 | Exceptional $111,243 |
| Immigrants | Argentina | 98.5 /100 | #89 | Exceptional $110,873 |
| Northern Europeans | 98.3 /100 | #90 | Exceptional $110,635 |
Demographics Similar to Blacks/African Americans by Median Family Income
In terms of median family income, the demographic groups most similar to Blacks/African Americans are Dutch West Indian ($81,852, a difference of 0.070%), Arapaho ($82,064, a difference of 0.18%), Immigrants from Congo ($82,216, a difference of 0.37%), Sioux ($82,386, a difference of 0.58%), and Cheyenne ($81,385, a difference of 0.65%).
| Demographics | Rating | Rank | Median Family Income |
| Immigrants | Caribbean | 0.0 /100 | #321 | Tragic $83,319 |
| Dominicans | 0.0 /100 | #322 | Tragic $82,888 |
| Bahamians | 0.0 /100 | #323 | Tragic $82,631 |
| Creek | 0.0 /100 | #324 | Tragic $82,560 |
| Sioux | 0.0 /100 | #325 | Tragic $82,386 |
| Immigrants | Congo | 0.0 /100 | #326 | Tragic $82,216 |
| Arapaho | 0.0 /100 | #327 | Tragic $82,064 |
| Blacks/African Americans | 0.0 /100 | #328 | Tragic $81,912 |
| Dutch West Indians | 0.0 /100 | #329 | Tragic $81,852 |
| Cheyenne | 0.0 /100 | #330 | Tragic $81,385 |
| Immigrants | Dominican Republic | 0.0 /100 | #331 | Tragic $81,233 |
| Natives/Alaskans | 0.0 /100 | #332 | Tragic $80,908 |
| Kiowa | 0.0 /100 | #333 | Tragic $80,885 |
| Menominee | 0.0 /100 | #334 | Tragic $79,563 |
| Yup'ik | 0.0 /100 | #335 | Tragic $79,290 |