Immigrants from South America vs U.S. Virgin Islander Median Male Earnings
COMPARE
Immigrants from South America
U.S. Virgin Islander
Median Male Earnings
Median Male Earnings Comparison
Immigrants from South America
U.S. Virgin Islanders
$53,962
MEDIAN MALE EARNINGS
37.3/ 100
METRIC RATING
183rd/ 347
METRIC RANK
$47,066
MEDIAN MALE EARNINGS
0.1/ 100
METRIC RATING
300th/ 347
METRIC RANK
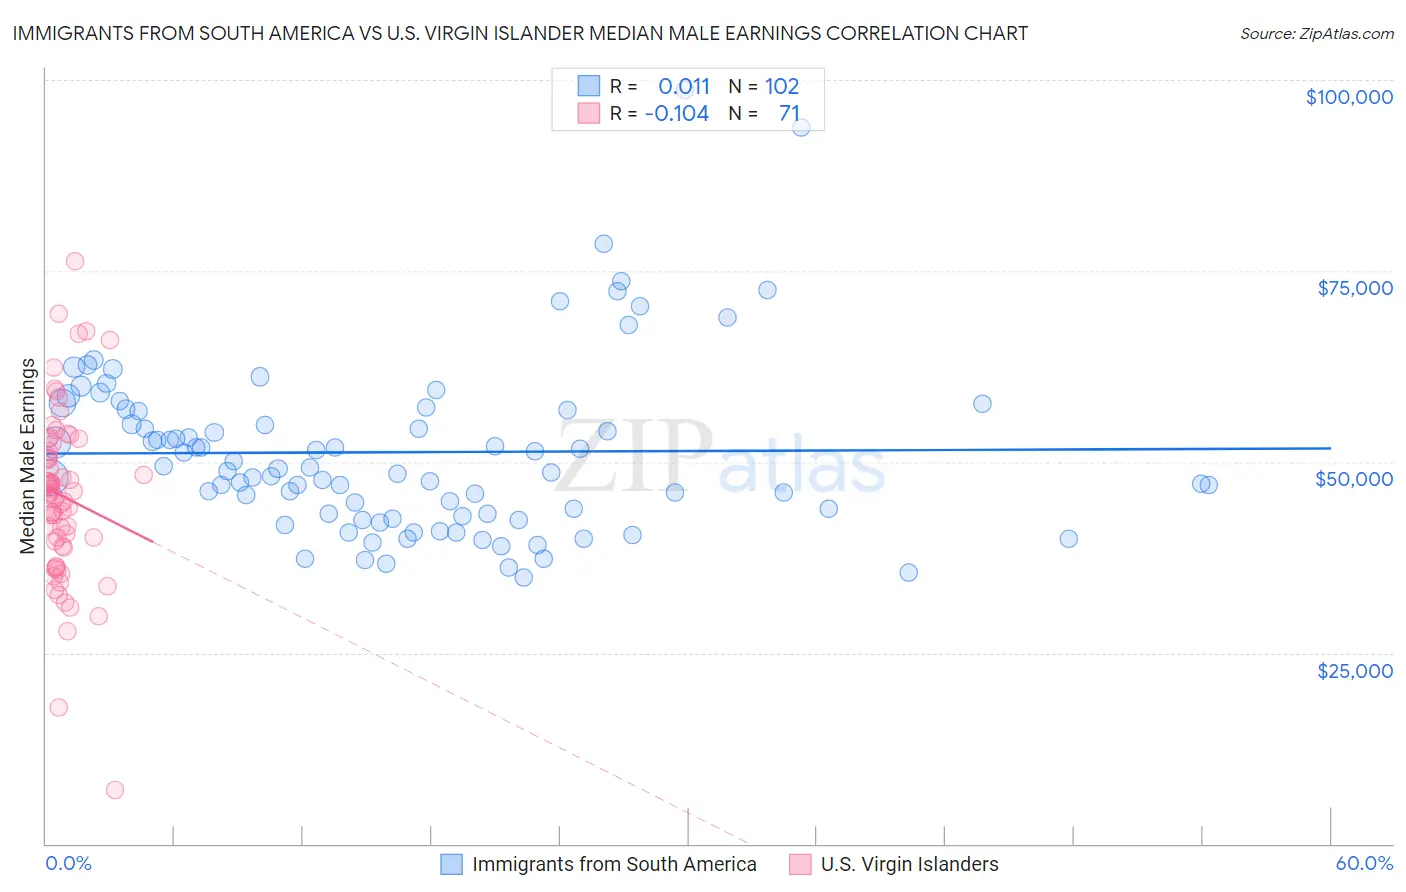
Immigrants from South America vs U.S. Virgin Islander Median Male Earnings Correlation Chart
The statistical analysis conducted on geographies consisting of 486,116,321 people shows no correlation between the proportion of Immigrants from South America and median male earnings in the United States with a correlation coefficient (R) of 0.011 and weighted average of $53,962. Similarly, the statistical analysis conducted on geographies consisting of 87,522,677 people shows a poor negative correlation between the proportion of U.S. Virgin Islanders and median male earnings in the United States with a correlation coefficient (R) of -0.104 and weighted average of $47,066, a difference of 14.6%.
Median Male Earnings Correlation Summary
| Measurement | Immigrants from South America | U.S. Virgin Islander |
| Minimum | $34,825 | $7,097 |
| Maximum | $98,656 | $76,348 |
| Range | $63,831 | $69,251 |
| Mean | $51,267 | $45,487 |
| Median | $48,941 | $45,658 |
| Interquartile 25% (IQ1) | $43,131 | $38,902 |
| Interquartile 75% (IQ3) | $56,719 | $52,442 |
| Interquartile Range (IQR) | $13,589 | $13,540 |
| Standard Deviation (Sample) | $11,368 | $11,420 |
| Standard Deviation (Population) | $11,312 | $11,340 |
Similar Demographics by Median Male Earnings
Demographics Similar to Immigrants from South America by Median Male Earnings
In terms of median male earnings, the demographic groups most similar to Immigrants from South America are Yugoslavian ($53,967, a difference of 0.010%), White/Caucasian ($53,925, a difference of 0.070%), Immigrants from Sierra Leone ($53,905, a difference of 0.11%), Colombian ($53,832, a difference of 0.24%), and Immigrants ($54,168, a difference of 0.38%).
| Demographics | Rating | Rank | Median Male Earnings |
| Spaniards | 47.8 /100 | #176 | Average $54,401 |
| Costa Ricans | 44.8 /100 | #177 | Average $54,279 |
| Sierra Leoneans | 44.8 /100 | #178 | Average $54,279 |
| Celtics | 43.9 /100 | #179 | Average $54,242 |
| Iraqis | 42.5 /100 | #180 | Average $54,182 |
| Immigrants | Immigrants | 42.1 /100 | #181 | Average $54,168 |
| Yugoslavians | 37.4 /100 | #182 | Fair $53,967 |
| Immigrants | South America | 37.3 /100 | #183 | Fair $53,962 |
| Whites/Caucasians | 36.5 /100 | #184 | Fair $53,925 |
| Immigrants | Sierra Leone | 36.0 /100 | #185 | Fair $53,905 |
| Colombians | 34.4 /100 | #186 | Fair $53,832 |
| Immigrants | Eritrea | 31.8 /100 | #187 | Fair $53,715 |
| Immigrants | Eastern Africa | 31.8 /100 | #188 | Fair $53,713 |
| Puget Sound Salish | 31.6 /100 | #189 | Fair $53,704 |
| Uruguayans | 31.1 /100 | #190 | Fair $53,680 |
Demographics Similar to U.S. Virgin Islanders by Median Male Earnings
In terms of median male earnings, the demographic groups most similar to U.S. Virgin Islanders are Immigrants from Zaire ($47,070, a difference of 0.010%), Immigrants from Micronesia ($47,177, a difference of 0.23%), Immigrants from Latin America ($46,941, a difference of 0.27%), Dominican ($47,204, a difference of 0.29%), and Inupiat ($47,281, a difference of 0.46%).
| Demographics | Rating | Rank | Median Male Earnings |
| Indonesians | 0.1 /100 | #293 | Tragic $47,503 |
| Immigrants | Nicaragua | 0.1 /100 | #294 | Tragic $47,482 |
| Central American Indians | 0.1 /100 | #295 | Tragic $47,433 |
| Inupiat | 0.1 /100 | #296 | Tragic $47,281 |
| Dominicans | 0.1 /100 | #297 | Tragic $47,204 |
| Immigrants | Micronesia | 0.1 /100 | #298 | Tragic $47,177 |
| Immigrants | Zaire | 0.1 /100 | #299 | Tragic $47,070 |
| U.S. Virgin Islanders | 0.1 /100 | #300 | Tragic $47,066 |
| Immigrants | Latin America | 0.1 /100 | #301 | Tragic $46,941 |
| Seminole | 0.1 /100 | #302 | Tragic $46,783 |
| Yaqui | 0.1 /100 | #303 | Tragic $46,777 |
| Bangladeshis | 0.1 /100 | #304 | Tragic $46,744 |
| Guatemalans | 0.0 /100 | #305 | Tragic $46,736 |
| Dutch West Indians | 0.0 /100 | #306 | Tragic $46,656 |
| Immigrants | Dominican Republic | 0.0 /100 | #307 | Tragic $46,655 |