Moroccan vs Immigrants from Iraq Female Poverty
COMPARE
Moroccan
Immigrants from Iraq
Female Poverty
Female Poverty Comparison
Moroccans
Immigrants from Iraq
14.3%
FEMALE POVERTY
7.2/ 100
METRIC RATING
211th/ 347
METRIC RANK
13.4%
FEMALE POVERTY
50.0/ 100
METRIC RATING
174th/ 347
METRIC RANK
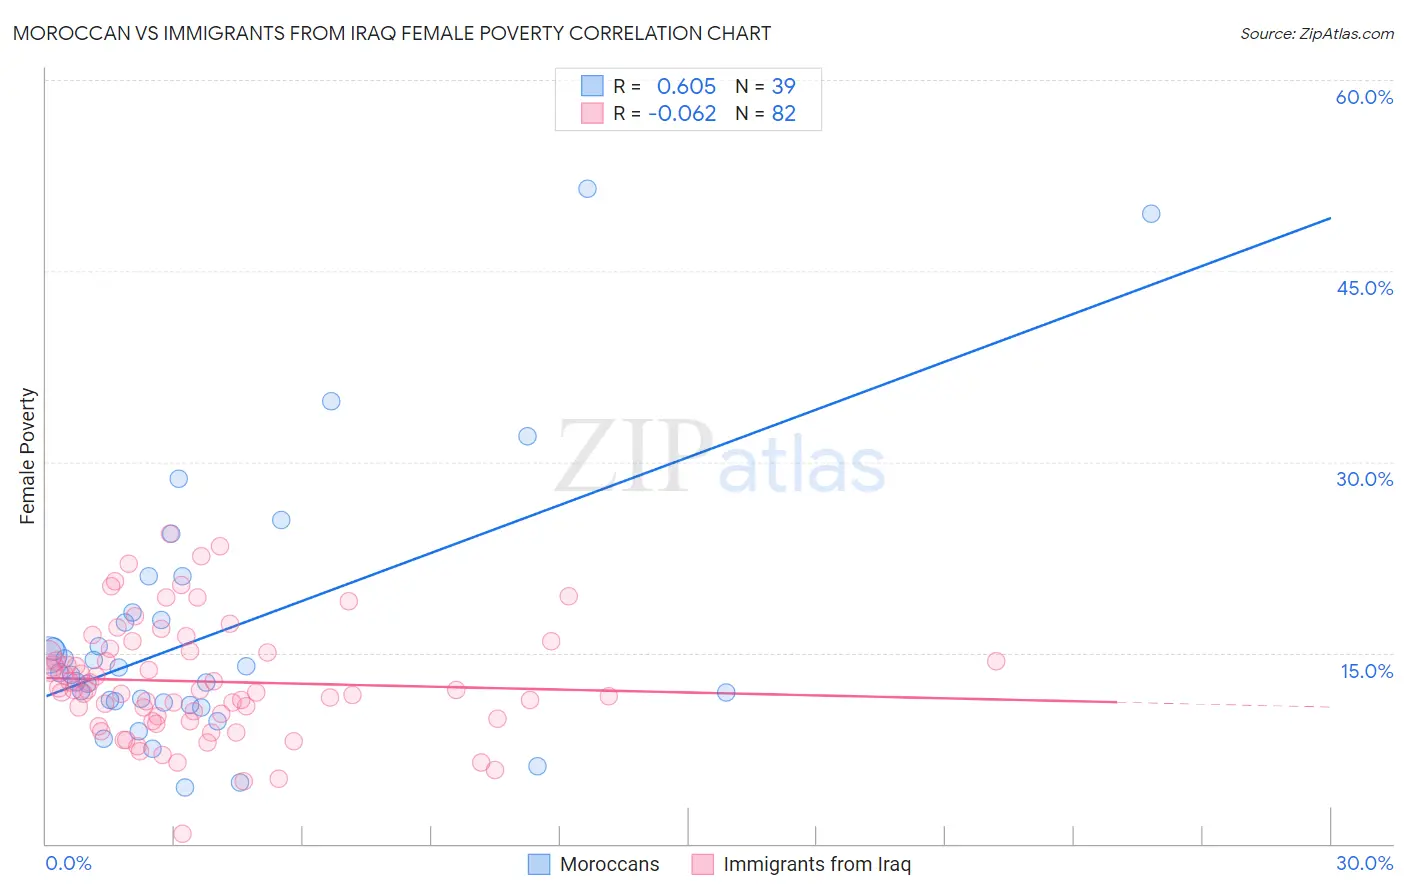
Moroccan vs Immigrants from Iraq Female Poverty Correlation Chart
The statistical analysis conducted on geographies consisting of 201,724,575 people shows a significant positive correlation between the proportion of Moroccans and poverty level among females in the United States with a correlation coefficient (R) of 0.605 and weighted average of 14.3%. Similarly, the statistical analysis conducted on geographies consisting of 194,711,025 people shows a slight negative correlation between the proportion of Immigrants from Iraq and poverty level among females in the United States with a correlation coefficient (R) of -0.062 and weighted average of 13.4%, a difference of 6.2%.
Female Poverty Correlation Summary
| Measurement | Moroccan | Immigrants from Iraq |
| Minimum | 4.4% | 0.80% |
| Maximum | 51.5% | 24.3% |
| Range | 47.1% | 23.5% |
| Mean | 16.6% | 12.7% |
| Median | 13.4% | 12.1% |
| Interquartile 25% (IQ1) | 11.1% | 9.8% |
| Interquartile 75% (IQ3) | 18.2% | 15.1% |
| Interquartile Range (IQR) | 7.1% | 5.3% |
| Standard Deviation (Sample) | 10.5% | 4.5% |
| Standard Deviation (Population) | 10.4% | 4.5% |
Similar Demographics by Female Poverty
Demographics Similar to Moroccans by Female Poverty
In terms of female poverty, the demographic groups most similar to Moroccans are Malaysian (14.3%, a difference of 0.080%), Panamanian (14.2%, a difference of 0.17%), Immigrants from the Azores (14.2%, a difference of 0.23%), Immigrants from Eastern Africa (14.2%, a difference of 0.58%), and Bermudan (14.4%, a difference of 0.63%).
| Demographics | Rating | Rank | Female Poverty |
| Spaniards | 18.9 /100 | #204 | Poor 13.9% |
| Ugandans | 15.4 /100 | #205 | Poor 14.0% |
| Immigrants | Uruguay | 14.0 /100 | #206 | Poor 14.0% |
| Immigrants | Eastern Africa | 9.0 /100 | #207 | Tragic 14.2% |
| Immigrants | Azores | 7.9 /100 | #208 | Tragic 14.2% |
| Panamanians | 7.7 /100 | #209 | Tragic 14.2% |
| Malaysians | 7.4 /100 | #210 | Tragic 14.3% |
| Moroccans | 7.2 /100 | #211 | Tragic 14.3% |
| Bermudans | 5.5 /100 | #212 | Tragic 14.4% |
| Alaskan Athabascans | 5.3 /100 | #213 | Tragic 14.4% |
| Marshallese | 5.0 /100 | #214 | Tragic 14.4% |
| Immigrants | Panama | 4.7 /100 | #215 | Tragic 14.4% |
| Immigrants | Thailand | 4.5 /100 | #216 | Tragic 14.4% |
| Immigrants | Immigrants | 4.5 /100 | #217 | Tragic 14.4% |
| Immigrants | Uzbekistan | 4.4 /100 | #218 | Tragic 14.4% |
Demographics Similar to Immigrants from Iraq by Female Poverty
In terms of female poverty, the demographic groups most similar to Immigrants from Iraq are Celtic (13.4%, a difference of 0.010%), Immigrants from Spain (13.4%, a difference of 0.010%), Immigrants from Morocco (13.4%, a difference of 0.060%), Immigrants from Afghanistan (13.4%, a difference of 0.070%), and Israeli (13.5%, a difference of 0.090%).
| Demographics | Rating | Rank | Female Poverty |
| Immigrants | Chile | 57.4 /100 | #167 | Average 13.3% |
| Aleuts | 56.7 /100 | #168 | Average 13.4% |
| Lebanese | 55.9 /100 | #169 | Average 13.4% |
| Colombians | 55.7 /100 | #170 | Average 13.4% |
| Whites/Caucasians | 54.6 /100 | #171 | Average 13.4% |
| Mongolians | 53.6 /100 | #172 | Average 13.4% |
| Immigrants | Afghanistan | 50.8 /100 | #173 | Average 13.4% |
| Immigrants | Iraq | 50.0 /100 | #174 | Average 13.4% |
| Celtics | 49.9 /100 | #175 | Average 13.4% |
| Immigrants | Spain | 49.9 /100 | #176 | Average 13.4% |
| Immigrants | Morocco | 49.4 /100 | #177 | Average 13.4% |
| Israelis | 49.1 /100 | #178 | Average 13.5% |
| Immigrants | Syria | 48.8 /100 | #179 | Average 13.5% |
| South Americans | 44.8 /100 | #180 | Average 13.5% |
| Venezuelans | 44.5 /100 | #181 | Average 13.5% |