Burmese vs Immigrants from Africa Per Capita Income
COMPARE
Burmese
Immigrants from Africa
Per Capita Income
Per Capita Income Comparison
Burmese
Immigrants from Africa
$52,005
PER CAPITA INCOME
100.0/ 100
METRIC RATING
35th/ 347
METRIC RANK
$42,950
PER CAPITA INCOME
31.0/ 100
METRIC RATING
188th/ 347
METRIC RANK
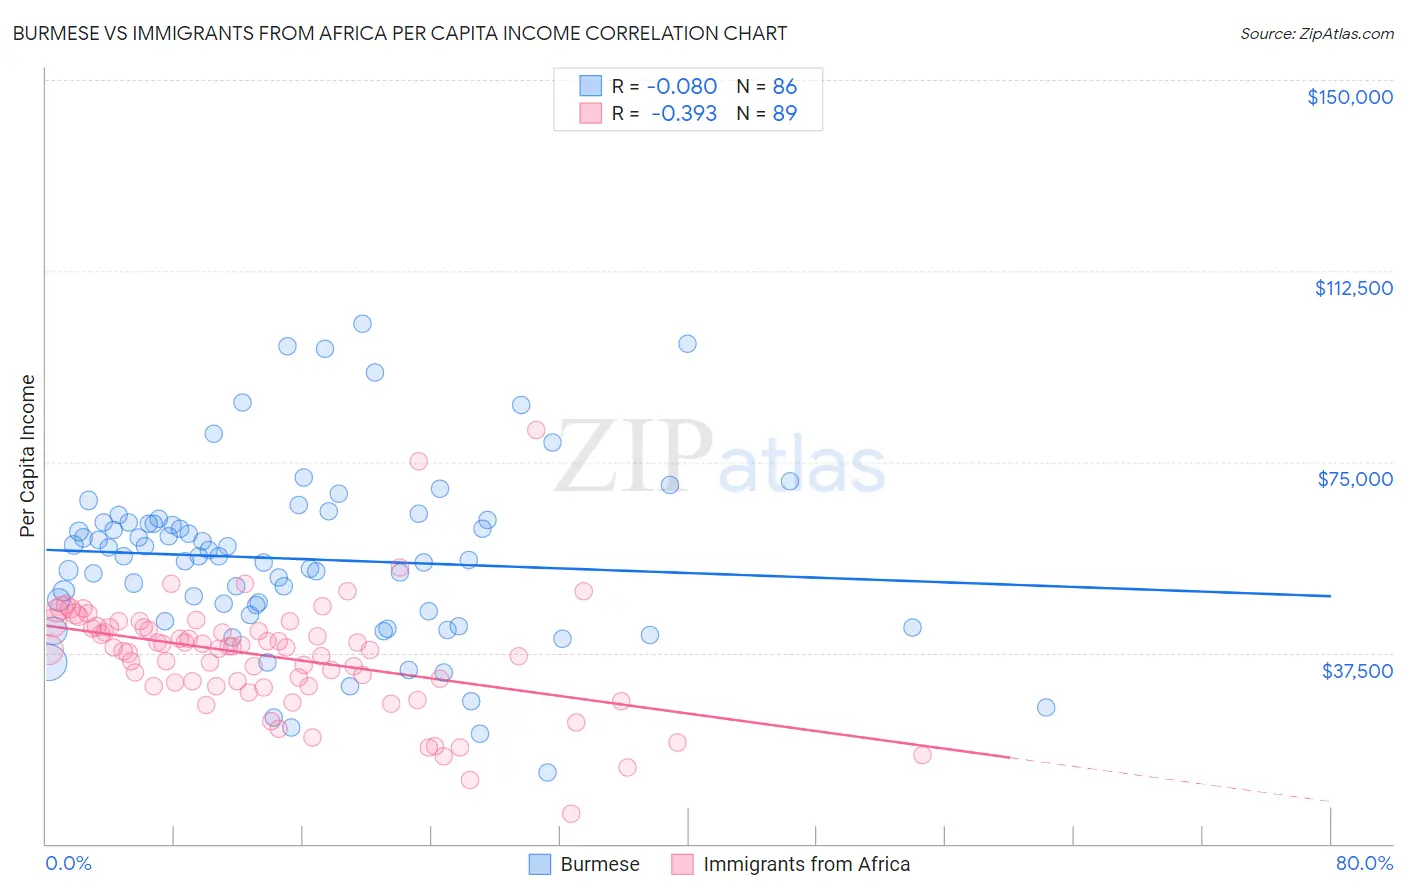
Burmese vs Immigrants from Africa Per Capita Income Correlation Chart
The statistical analysis conducted on geographies consisting of 465,453,233 people shows a slight negative correlation between the proportion of Burmese and per capita income in the United States with a correlation coefficient (R) of -0.080 and weighted average of $52,005. Similarly, the statistical analysis conducted on geographies consisting of 469,482,271 people shows a mild negative correlation between the proportion of Immigrants from Africa and per capita income in the United States with a correlation coefficient (R) of -0.393 and weighted average of $42,950, a difference of 21.1%.
Per Capita Income Correlation Summary
| Measurement | Burmese | Immigrants from Africa |
| Minimum | $14,082 | $5,866 |
| Maximum | $102,113 | $81,151 |
| Range | $88,031 | $75,285 |
| Mean | $55,927 | $36,831 |
| Median | $56,416 | $38,619 |
| Interquartile 25% (IQ1) | $45,035 | $30,955 |
| Interquartile 75% (IQ3) | $63,196 | $42,606 |
| Interquartile Range (IQR) | $18,162 | $11,650 |
| Standard Deviation (Sample) | $17,378 | $11,377 |
| Standard Deviation (Population) | $17,276 | $11,312 |
Similar Demographics by Per Capita Income
Demographics Similar to Burmese by Per Capita Income
In terms of per capita income, the demographic groups most similar to Burmese are Immigrants from Russia ($52,044, a difference of 0.070%), Australian ($52,074, a difference of 0.13%), Immigrants from Greece ($51,891, a difference of 0.22%), Estonian ($51,875, a difference of 0.25%), and Immigrants from Norway ($52,217, a difference of 0.41%).
| Demographics | Rating | Rank | Per Capita Income |
| Latvians | 100.0 /100 | #28 | Exceptional $52,649 |
| Israelis | 100.0 /100 | #29 | Exceptional $52,596 |
| Immigrants | Austria | 100.0 /100 | #30 | Exceptional $52,503 |
| Turks | 100.0 /100 | #31 | Exceptional $52,391 |
| Immigrants | Norway | 100.0 /100 | #32 | Exceptional $52,217 |
| Australians | 100.0 /100 | #33 | Exceptional $52,074 |
| Immigrants | Russia | 100.0 /100 | #34 | Exceptional $52,044 |
| Burmese | 100.0 /100 | #35 | Exceptional $52,005 |
| Immigrants | Greece | 100.0 /100 | #36 | Exceptional $51,891 |
| Estonians | 100.0 /100 | #37 | Exceptional $51,875 |
| Immigrants | Czechoslovakia | 100.0 /100 | #38 | Exceptional $51,770 |
| Cambodians | 100.0 /100 | #39 | Exceptional $51,731 |
| Immigrants | Korea | 100.0 /100 | #40 | Exceptional $51,671 |
| Immigrants | South Africa | 100.0 /100 | #41 | Exceptional $51,465 |
| Immigrants | Turkey | 100.0 /100 | #42 | Exceptional $51,368 |
Demographics Similar to Immigrants from Africa by Per Capita Income
In terms of per capita income, the demographic groups most similar to Immigrants from Africa are Immigrants from Colombia ($42,971, a difference of 0.050%), Bermudan ($42,911, a difference of 0.090%), French Canadian ($43,003, a difference of 0.12%), Immigrants ($43,010, a difference of 0.14%), and Spaniard ($43,028, a difference of 0.18%).
| Demographics | Rating | Rank | Per Capita Income |
| Welsh | 38.2 /100 | #181 | Fair $43,233 |
| Immigrants | Vietnam | 38.1 /100 | #182 | Fair $43,229 |
| Germans | 33.9 /100 | #183 | Fair $43,067 |
| Spaniards | 32.9 /100 | #184 | Fair $43,028 |
| Immigrants | Immigrants | 32.5 /100 | #185 | Fair $43,010 |
| French Canadians | 32.3 /100 | #186 | Fair $43,003 |
| Immigrants | Colombia | 31.5 /100 | #187 | Fair $42,971 |
| Immigrants | Africa | 31.0 /100 | #188 | Fair $42,950 |
| Bermudans | 30.1 /100 | #189 | Fair $42,911 |
| Kenyans | 27.7 /100 | #190 | Fair $42,808 |
| Yugoslavians | 27.4 /100 | #191 | Fair $42,792 |
| Iraqis | 26.7 /100 | #192 | Fair $42,760 |
| Immigrants | Sierra Leone | 26.5 /100 | #193 | Fair $42,752 |
| Immigrants | Fiji | 25.2 /100 | #194 | Fair $42,694 |
| Immigrants | Kenya | 24.5 /100 | #195 | Fair $42,661 |