Mongolian vs Immigrants from Ethiopia Median Earnings
COMPARE
Mongolian
Immigrants from Ethiopia
Median Earnings
Median Earnings Comparison
Mongolians
Immigrants from Ethiopia
$51,038
MEDIAN EARNINGS
99.8/ 100
METRIC RATING
69th/ 347
METRIC RANK
$48,924
MEDIAN EARNINGS
97.1/ 100
METRIC RATING
110th/ 347
METRIC RANK
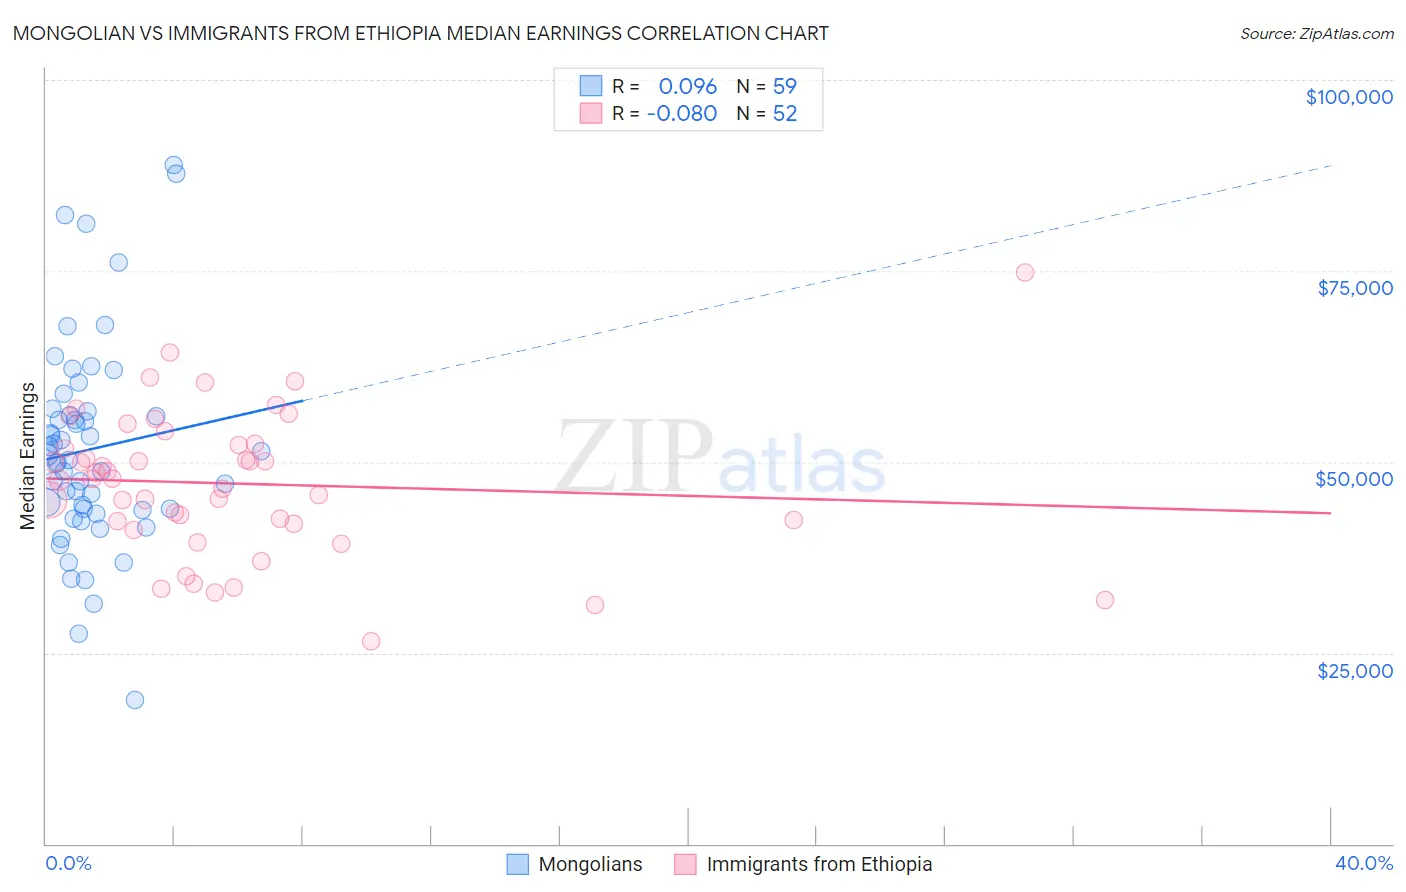
Mongolian vs Immigrants from Ethiopia Median Earnings Correlation Chart
The statistical analysis conducted on geographies consisting of 140,341,954 people shows a slight positive correlation between the proportion of Mongolians and median earnings in the United States with a correlation coefficient (R) of 0.096 and weighted average of $51,038. Similarly, the statistical analysis conducted on geographies consisting of 211,566,238 people shows a slight negative correlation between the proportion of Immigrants from Ethiopia and median earnings in the United States with a correlation coefficient (R) of -0.080 and weighted average of $48,924, a difference of 4.3%.
Median Earnings Correlation Summary
| Measurement | Mongolian | Immigrants from Ethiopia |
| Minimum | $18,750 | $26,567 |
| Maximum | $88,819 | $74,844 |
| Range | $70,069 | $48,277 |
| Mean | $51,652 | $47,171 |
| Median | $50,317 | $47,805 |
| Interquartile 25% (IQ1) | $43,750 | $42,088 |
| Interquartile 75% (IQ3) | $56,610 | $52,349 |
| Interquartile Range (IQR) | $12,860 | $10,261 |
| Standard Deviation (Sample) | $13,573 | $9,417 |
| Standard Deviation (Population) | $13,457 | $9,326 |
Similar Demographics by Median Earnings
Demographics Similar to Mongolians by Median Earnings
In terms of median earnings, the demographic groups most similar to Mongolians are Paraguayan ($51,068, a difference of 0.060%), Lithuanian ($50,991, a difference of 0.090%), Immigrants from Ukraine ($50,984, a difference of 0.10%), Immigrants from Spain ($51,092, a difference of 0.11%), and Afghan ($51,112, a difference of 0.15%).
| Demographics | Rating | Rank | Median Earnings |
| Immigrants | Romania | 99.9 /100 | #62 | Exceptional $51,337 |
| Immigrants | Bulgaria | 99.9 /100 | #63 | Exceptional $51,318 |
| New Zealanders | 99.9 /100 | #64 | Exceptional $51,246 |
| Greeks | 99.9 /100 | #65 | Exceptional $51,164 |
| Afghans | 99.9 /100 | #66 | Exceptional $51,112 |
| Immigrants | Spain | 99.9 /100 | #67 | Exceptional $51,092 |
| Paraguayans | 99.9 /100 | #68 | Exceptional $51,068 |
| Mongolians | 99.8 /100 | #69 | Exceptional $51,038 |
| Lithuanians | 99.8 /100 | #70 | Exceptional $50,991 |
| Immigrants | Ukraine | 99.8 /100 | #71 | Exceptional $50,984 |
| Immigrants | Egypt | 99.8 /100 | #72 | Exceptional $50,901 |
| Immigrants | Netherlands | 99.8 /100 | #73 | Exceptional $50,818 |
| South Africans | 99.8 /100 | #74 | Exceptional $50,752 |
| Immigrants | Scotland | 99.8 /100 | #75 | Exceptional $50,741 |
| Immigrants | Italy | 99.7 /100 | #76 | Exceptional $50,581 |
Demographics Similar to Immigrants from Ethiopia by Median Earnings
In terms of median earnings, the demographic groups most similar to Immigrants from Ethiopia are Syrian ($48,934, a difference of 0.020%), Immigrants from Zimbabwe ($48,913, a difference of 0.020%), Northern European ($48,887, a difference of 0.070%), Immigrants from Kuwait ($48,861, a difference of 0.13%), and Moroccan ($48,838, a difference of 0.17%).
| Demographics | Rating | Rank | Median Earnings |
| Austrians | 98.7 /100 | #103 | Exceptional $49,501 |
| Immigrants | Brazil | 98.6 /100 | #104 | Exceptional $49,463 |
| Immigrants | Western Asia | 98.4 /100 | #105 | Exceptional $49,389 |
| Immigrants | Albania | 98.4 /100 | #106 | Exceptional $49,377 |
| Immigrants | Morocco | 98.4 /100 | #107 | Exceptional $49,368 |
| Palestinians | 98.0 /100 | #108 | Exceptional $49,209 |
| Syrians | 97.1 /100 | #109 | Exceptional $48,934 |
| Immigrants | Ethiopia | 97.1 /100 | #110 | Exceptional $48,924 |
| Immigrants | Zimbabwe | 97.0 /100 | #111 | Exceptional $48,913 |
| Northern Europeans | 96.9 /100 | #112 | Exceptional $48,887 |
| Immigrants | Kuwait | 96.8 /100 | #113 | Exceptional $48,861 |
| Moroccans | 96.7 /100 | #114 | Exceptional $48,838 |
| Chinese | 96.7 /100 | #115 | Exceptional $48,836 |
| Koreans | 96.2 /100 | #116 | Exceptional $48,727 |
| Serbians | 95.9 /100 | #117 | Exceptional $48,677 |