Mongolian vs Peruvian Median Earnings
COMPARE
Mongolian
Peruvian
Median Earnings
Median Earnings Comparison
Mongolians
Peruvians
$51,038
MEDIAN EARNINGS
99.8/ 100
METRIC RATING
69th/ 347
METRIC RANK
$47,628
MEDIAN EARNINGS
84.2/ 100
METRIC RATING
150th/ 347
METRIC RANK
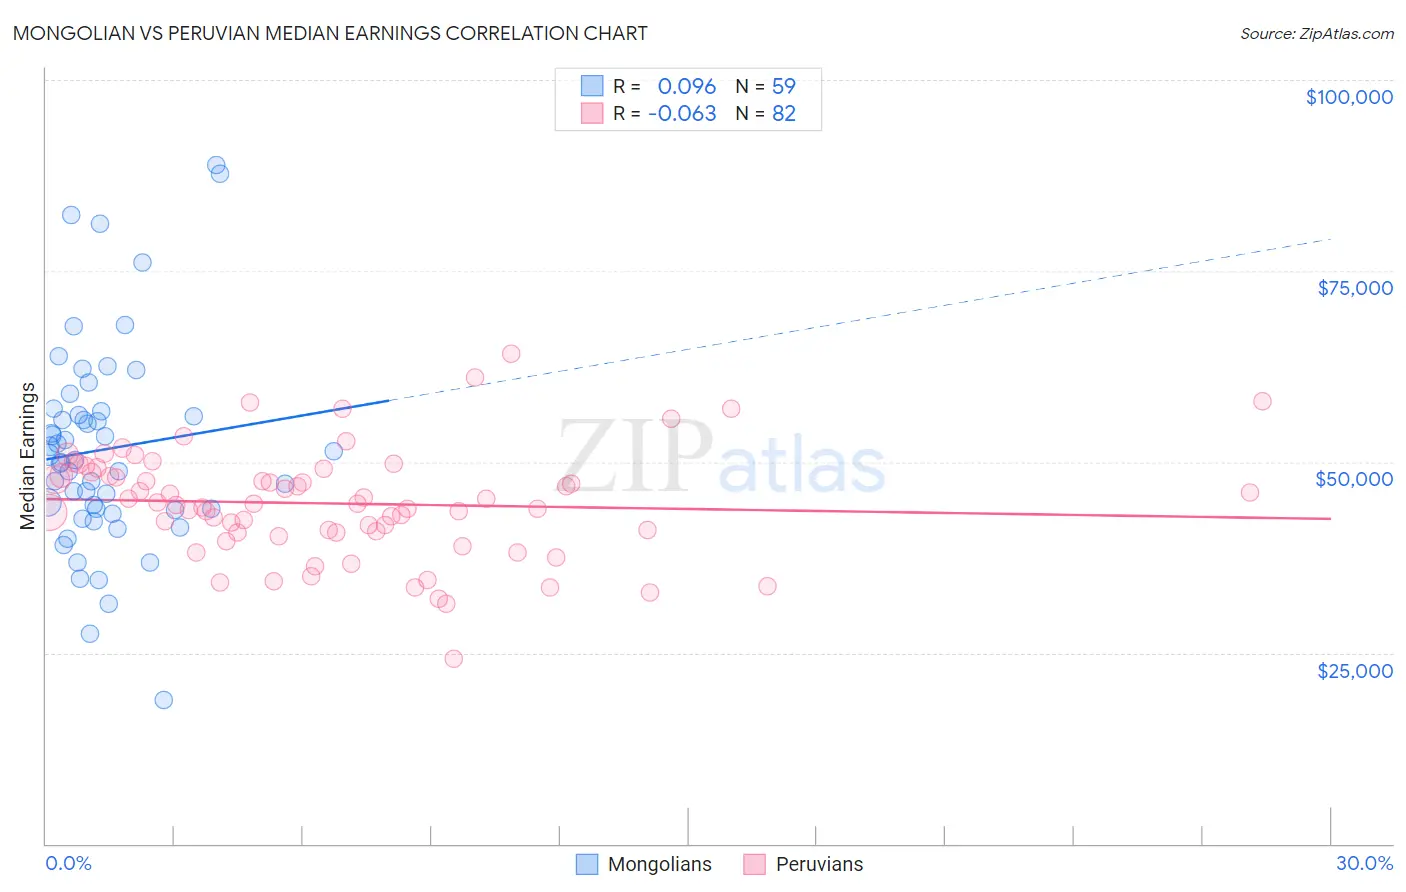
Mongolian vs Peruvian Median Earnings Correlation Chart
The statistical analysis conducted on geographies consisting of 140,341,954 people shows a slight positive correlation between the proportion of Mongolians and median earnings in the United States with a correlation coefficient (R) of 0.096 and weighted average of $51,038. Similarly, the statistical analysis conducted on geographies consisting of 363,247,580 people shows a slight negative correlation between the proportion of Peruvians and median earnings in the United States with a correlation coefficient (R) of -0.063 and weighted average of $47,628, a difference of 7.2%.
Median Earnings Correlation Summary
| Measurement | Mongolian | Peruvian |
| Minimum | $18,750 | $24,212 |
| Maximum | $88,819 | $64,091 |
| Range | $70,069 | $39,879 |
| Mean | $51,652 | $44,547 |
| Median | $50,317 | $44,525 |
| Interquartile 25% (IQ1) | $43,750 | $40,828 |
| Interquartile 75% (IQ3) | $56,610 | $48,604 |
| Interquartile Range (IQR) | $12,860 | $7,775 |
| Standard Deviation (Sample) | $13,573 | $7,153 |
| Standard Deviation (Population) | $13,457 | $7,110 |
Similar Demographics by Median Earnings
Demographics Similar to Mongolians by Median Earnings
In terms of median earnings, the demographic groups most similar to Mongolians are Paraguayan ($51,068, a difference of 0.060%), Lithuanian ($50,991, a difference of 0.090%), Immigrants from Ukraine ($50,984, a difference of 0.10%), Immigrants from Spain ($51,092, a difference of 0.11%), and Afghan ($51,112, a difference of 0.15%).
| Demographics | Rating | Rank | Median Earnings |
| Immigrants | Romania | 99.9 /100 | #62 | Exceptional $51,337 |
| Immigrants | Bulgaria | 99.9 /100 | #63 | Exceptional $51,318 |
| New Zealanders | 99.9 /100 | #64 | Exceptional $51,246 |
| Greeks | 99.9 /100 | #65 | Exceptional $51,164 |
| Afghans | 99.9 /100 | #66 | Exceptional $51,112 |
| Immigrants | Spain | 99.9 /100 | #67 | Exceptional $51,092 |
| Paraguayans | 99.9 /100 | #68 | Exceptional $51,068 |
| Mongolians | 99.8 /100 | #69 | Exceptional $51,038 |
| Lithuanians | 99.8 /100 | #70 | Exceptional $50,991 |
| Immigrants | Ukraine | 99.8 /100 | #71 | Exceptional $50,984 |
| Immigrants | Egypt | 99.8 /100 | #72 | Exceptional $50,901 |
| Immigrants | Netherlands | 99.8 /100 | #73 | Exceptional $50,818 |
| South Africans | 99.8 /100 | #74 | Exceptional $50,752 |
| Immigrants | Scotland | 99.8 /100 | #75 | Exceptional $50,741 |
| Immigrants | Italy | 99.7 /100 | #76 | Exceptional $50,581 |
Demographics Similar to Peruvians by Median Earnings
In terms of median earnings, the demographic groups most similar to Peruvians are Luxembourger ($47,640, a difference of 0.020%), Immigrants from Oceania ($47,617, a difference of 0.020%), Immigrants from Eritrea ($47,657, a difference of 0.060%), Immigrants from South Eastern Asia ($47,671, a difference of 0.090%), and Immigrants from Germany ($47,566, a difference of 0.13%).
| Demographics | Rating | Rank | Median Earnings |
| Swedes | 88.0 /100 | #143 | Excellent $47,851 |
| Hungarians | 87.1 /100 | #144 | Excellent $47,795 |
| Immigrants | Saudi Arabia | 85.6 /100 | #145 | Excellent $47,704 |
| Immigrants | Chile | 85.5 /100 | #146 | Excellent $47,697 |
| Immigrants | South Eastern Asia | 85.0 /100 | #147 | Excellent $47,671 |
| Immigrants | Eritrea | 84.8 /100 | #148 | Excellent $47,657 |
| Luxembourgers | 84.5 /100 | #149 | Excellent $47,640 |
| Peruvians | 84.2 /100 | #150 | Excellent $47,628 |
| Immigrants | Oceania | 84.1 /100 | #151 | Excellent $47,617 |
| Immigrants | Germany | 83.1 /100 | #152 | Excellent $47,566 |
| Slavs | 81.1 /100 | #153 | Excellent $47,470 |
| Immigrants | Portugal | 77.3 /100 | #154 | Good $47,304 |
| Immigrants | Vietnam | 76.7 /100 | #155 | Good $47,282 |
| Irish | 76.6 /100 | #156 | Good $47,276 |
| Czechs | 75.1 /100 | #157 | Good $47,221 |