Immigrants from Trinidad and Tobago vs Peruvian Median Earnings
COMPARE
Immigrants from Trinidad and Tobago
Peruvian
Median Earnings
Median Earnings Comparison
Immigrants from Trinidad and Tobago
Peruvians
$45,729
MEDIAN EARNINGS
27.1/ 100
METRIC RATING
202nd/ 347
METRIC RANK
$47,628
MEDIAN EARNINGS
84.2/ 100
METRIC RATING
150th/ 347
METRIC RANK
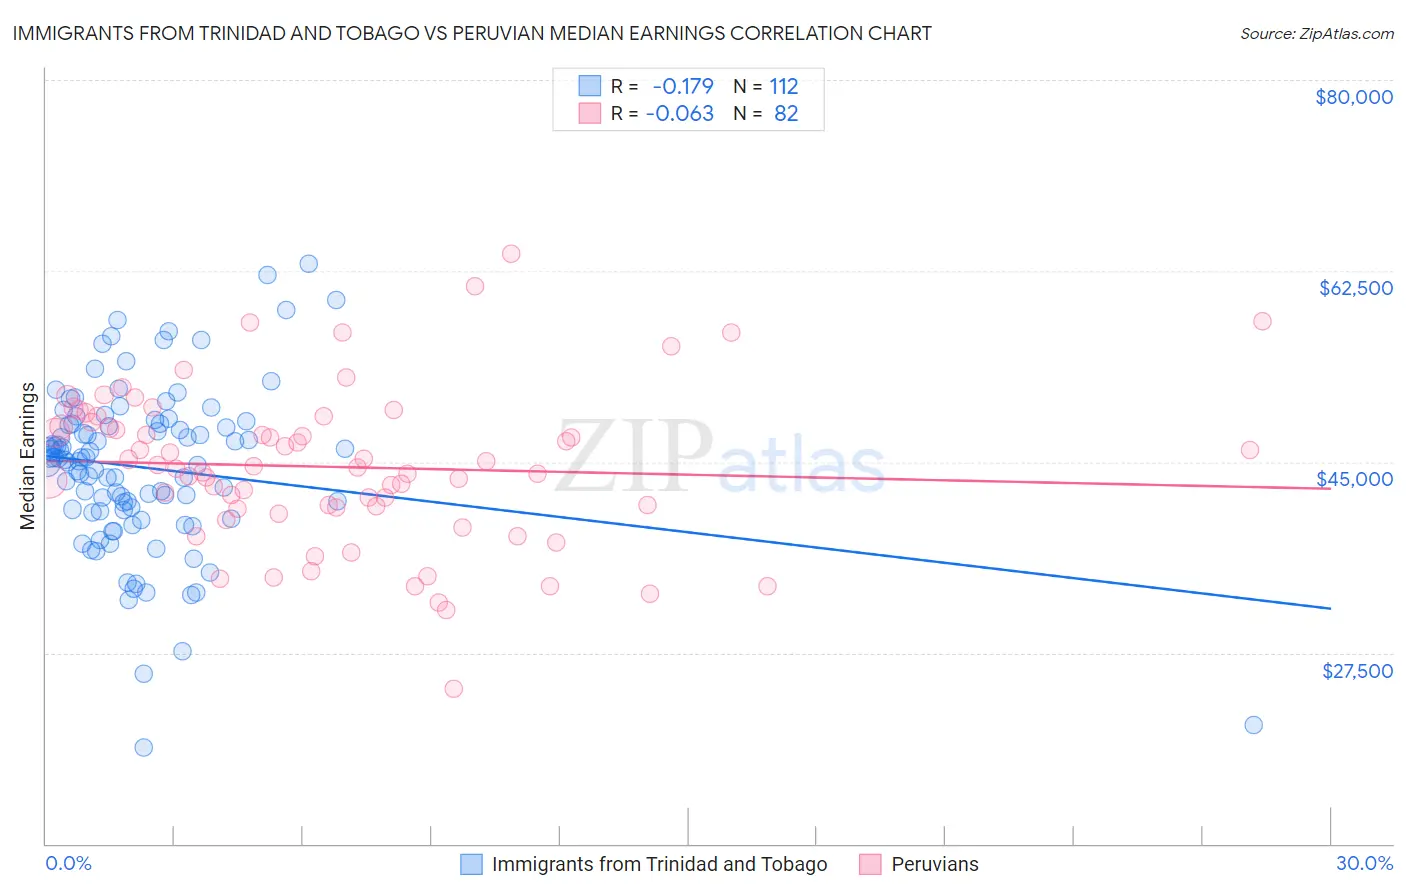
Immigrants from Trinidad and Tobago vs Peruvian Median Earnings Correlation Chart
The statistical analysis conducted on geographies consisting of 223,533,236 people shows a poor negative correlation between the proportion of Immigrants from Trinidad and Tobago and median earnings in the United States with a correlation coefficient (R) of -0.179 and weighted average of $45,729. Similarly, the statistical analysis conducted on geographies consisting of 363,247,580 people shows a slight negative correlation between the proportion of Peruvians and median earnings in the United States with a correlation coefficient (R) of -0.063 and weighted average of $47,628, a difference of 4.2%.
Median Earnings Correlation Summary
| Measurement | Immigrants from Trinidad and Tobago | Peruvian |
| Minimum | $18,800 | $24,212 |
| Maximum | $63,173 | $64,091 |
| Range | $44,373 | $39,879 |
| Mean | $44,457 | $44,547 |
| Median | $45,233 | $44,525 |
| Interquartile 25% (IQ1) | $40,492 | $40,828 |
| Interquartile 75% (IQ3) | $48,494 | $48,604 |
| Interquartile Range (IQR) | $8,002 | $7,775 |
| Standard Deviation (Sample) | $7,633 | $7,153 |
| Standard Deviation (Population) | $7,598 | $7,110 |
Similar Demographics by Median Earnings
Demographics Similar to Immigrants from Trinidad and Tobago by Median Earnings
In terms of median earnings, the demographic groups most similar to Immigrants from Trinidad and Tobago are Celtic ($45,732, a difference of 0.010%), Welsh ($45,710, a difference of 0.040%), Immigrants from Uruguay ($45,682, a difference of 0.10%), Tongan ($45,665, a difference of 0.14%), and Immigrants from the Azores ($45,812, a difference of 0.18%).
| Demographics | Rating | Rank | Median Earnings |
| Immigrants | St. Vincent and the Grenadines | 32.4 /100 | #195 | Fair $45,908 |
| Yugoslavians | 30.5 /100 | #196 | Fair $45,846 |
| Barbadians | 30.5 /100 | #197 | Fair $45,846 |
| Trinidadians and Tobagonians | 29.7 /100 | #198 | Fair $45,820 |
| Immigrants | Barbados | 29.6 /100 | #199 | Fair $45,816 |
| Immigrants | Azores | 29.5 /100 | #200 | Fair $45,812 |
| Celtics | 27.2 /100 | #201 | Fair $45,732 |
| Immigrants | Trinidad and Tobago | 27.1 /100 | #202 | Fair $45,729 |
| Welsh | 26.6 /100 | #203 | Fair $45,710 |
| Immigrants | Uruguay | 25.9 /100 | #204 | Fair $45,682 |
| Tongans | 25.4 /100 | #205 | Fair $45,665 |
| Immigrants | Ghana | 24.8 /100 | #206 | Fair $45,641 |
| Immigrants | Senegal | 24.0 /100 | #207 | Fair $45,611 |
| Immigrants | Bosnia and Herzegovina | 23.7 /100 | #208 | Fair $45,600 |
| Immigrants | Thailand | 23.7 /100 | #209 | Fair $45,598 |
Demographics Similar to Peruvians by Median Earnings
In terms of median earnings, the demographic groups most similar to Peruvians are Luxembourger ($47,640, a difference of 0.020%), Immigrants from Oceania ($47,617, a difference of 0.020%), Immigrants from Eritrea ($47,657, a difference of 0.060%), Immigrants from South Eastern Asia ($47,671, a difference of 0.090%), and Immigrants from Germany ($47,566, a difference of 0.13%).
| Demographics | Rating | Rank | Median Earnings |
| Swedes | 88.0 /100 | #143 | Excellent $47,851 |
| Hungarians | 87.1 /100 | #144 | Excellent $47,795 |
| Immigrants | Saudi Arabia | 85.6 /100 | #145 | Excellent $47,704 |
| Immigrants | Chile | 85.5 /100 | #146 | Excellent $47,697 |
| Immigrants | South Eastern Asia | 85.0 /100 | #147 | Excellent $47,671 |
| Immigrants | Eritrea | 84.8 /100 | #148 | Excellent $47,657 |
| Luxembourgers | 84.5 /100 | #149 | Excellent $47,640 |
| Peruvians | 84.2 /100 | #150 | Excellent $47,628 |
| Immigrants | Oceania | 84.1 /100 | #151 | Excellent $47,617 |
| Immigrants | Germany | 83.1 /100 | #152 | Excellent $47,566 |
| Slavs | 81.1 /100 | #153 | Excellent $47,470 |
| Immigrants | Portugal | 77.3 /100 | #154 | Good $47,304 |
| Immigrants | Vietnam | 76.7 /100 | #155 | Good $47,282 |
| Irish | 76.6 /100 | #156 | Good $47,276 |
| Czechs | 75.1 /100 | #157 | Good $47,221 |