Mongolian vs Lithuanian Male Unemployment
COMPARE
Mongolian
Lithuanian
Male Unemployment
Male Unemployment Comparison
Mongolians
Lithuanians
5.1%
MALE UNEMPLOYMENT
88.4/ 100
METRIC RATING
121st/ 347
METRIC RANK
5.0%
MALE UNEMPLOYMENT
98.5/ 100
METRIC RATING
58th/ 347
METRIC RANK
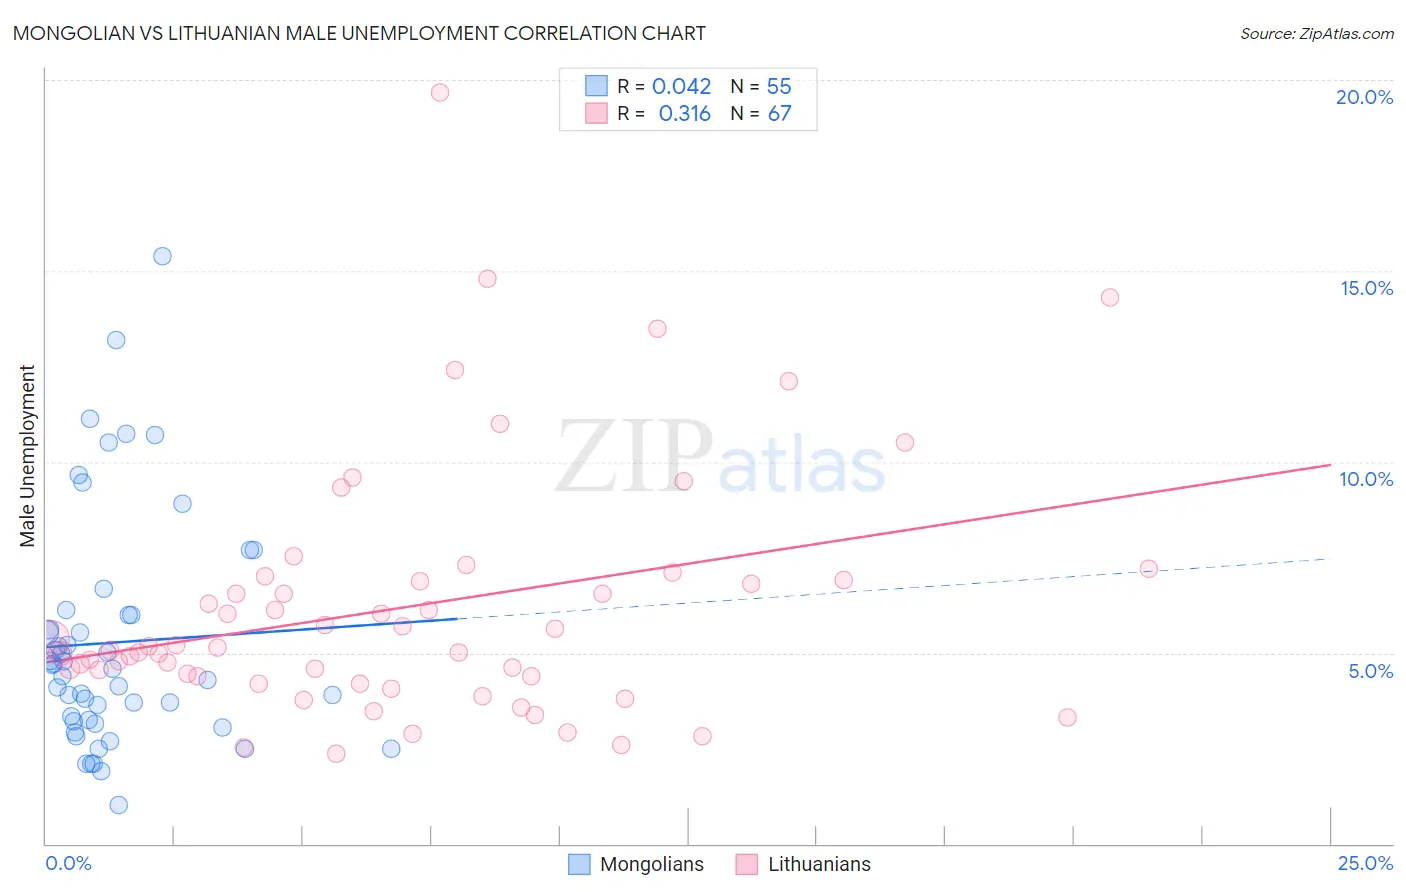
Mongolian vs Lithuanian Male Unemployment Correlation Chart
The statistical analysis conducted on geographies consisting of 140,285,925 people shows no correlation between the proportion of Mongolians and unemployment rate among males in the United States with a correlation coefficient (R) of 0.042 and weighted average of 5.1%. Similarly, the statistical analysis conducted on geographies consisting of 419,508,193 people shows a mild positive correlation between the proportion of Lithuanians and unemployment rate among males in the United States with a correlation coefficient (R) of 0.316 and weighted average of 5.0%, a difference of 3.3%.
Male Unemployment Correlation Summary
| Measurement | Mongolian | Lithuanian |
| Minimum | 1.0% | 2.4% |
| Maximum | 15.4% | 19.7% |
| Range | 14.4% | 17.3% |
| Mean | 5.3% | 6.2% |
| Median | 4.6% | 5.2% |
| Interquartile 25% (IQ1) | 3.2% | 4.4% |
| Interquartile 75% (IQ3) | 6.0% | 6.9% |
| Interquartile Range (IQR) | 2.8% | 2.5% |
| Standard Deviation (Sample) | 3.0% | 3.3% |
| Standard Deviation (Population) | 3.0% | 3.2% |
Similar Demographics by Male Unemployment
Demographics Similar to Mongolians by Male Unemployment
In terms of male unemployment, the demographic groups most similar to Mongolians are Ukrainian (5.1%, a difference of 0.010%), French Canadian (5.1%, a difference of 0.030%), Nicaraguan (5.1%, a difference of 0.030%), Cypriot (5.1%, a difference of 0.070%), and Estonian (5.1%, a difference of 0.10%).
| Demographics | Rating | Rank | Male Unemployment |
| Romanians | 89.8 /100 | #114 | Excellent 5.1% |
| Immigrants | Asia | 89.6 /100 | #115 | Excellent 5.1% |
| Immigrants | Denmark | 89.4 /100 | #116 | Excellent 5.1% |
| Estonians | 89.0 /100 | #117 | Excellent 5.1% |
| Cypriots | 88.8 /100 | #118 | Excellent 5.1% |
| French Canadians | 88.6 /100 | #119 | Excellent 5.1% |
| Ukrainians | 88.4 /100 | #120 | Excellent 5.1% |
| Mongolians | 88.4 /100 | #121 | Excellent 5.1% |
| Nicaraguans | 88.2 /100 | #122 | Excellent 5.1% |
| Palestinians | 87.7 /100 | #123 | Excellent 5.1% |
| Immigrants | Latvia | 87.5 /100 | #124 | Excellent 5.1% |
| Immigrants | Lithuania | 87.2 /100 | #125 | Excellent 5.1% |
| Immigrants | Colombia | 86.8 /100 | #126 | Excellent 5.1% |
| Immigrants | Brazil | 86.3 /100 | #127 | Excellent 5.2% |
| Hungarians | 85.1 /100 | #128 | Excellent 5.2% |
Demographics Similar to Lithuanians by Male Unemployment
In terms of male unemployment, the demographic groups most similar to Lithuanians are Turkish (5.0%, a difference of 0.0%), Immigrants from Netherlands (5.0%, a difference of 0.14%), Immigrants from Bulgaria (5.0%, a difference of 0.23%), Yugoslavian (5.0%, a difference of 0.24%), and Czechoslovakian (5.0%, a difference of 0.24%).
| Demographics | Rating | Rank | Male Unemployment |
| Slovenes | 98.8 /100 | #51 | Exceptional 5.0% |
| Irish | 98.8 /100 | #52 | Exceptional 5.0% |
| Jordanians | 98.8 /100 | #53 | Exceptional 5.0% |
| Yugoslavians | 98.7 /100 | #54 | Exceptional 5.0% |
| Czechoslovakians | 98.7 /100 | #55 | Exceptional 5.0% |
| Immigrants | Bulgaria | 98.7 /100 | #56 | Exceptional 5.0% |
| Turks | 98.5 /100 | #57 | Exceptional 5.0% |
| Lithuanians | 98.5 /100 | #58 | Exceptional 5.0% |
| Immigrants | Netherlands | 98.3 /100 | #59 | Exceptional 5.0% |
| Immigrants | Argentina | 98.1 /100 | #60 | Exceptional 5.0% |
| Cambodians | 98.1 /100 | #61 | Exceptional 5.0% |
| Basques | 97.9 /100 | #62 | Exceptional 5.0% |
| Eastern Europeans | 97.9 /100 | #63 | Exceptional 5.0% |
| Celtics | 97.8 /100 | #64 | Exceptional 5.0% |
| Icelanders | 97.6 /100 | #65 | Exceptional 5.0% |