Bolivian vs Delaware Median Male Earnings
COMPARE
Bolivian
Delaware
Median Male Earnings
Median Male Earnings Comparison
Bolivians
Delaware
$61,066
MEDIAN MALE EARNINGS
99.8/ 100
METRIC RATING
61st/ 347
METRIC RANK
$52,412
MEDIAN MALE EARNINGS
11.5/ 100
METRIC RATING
210th/ 347
METRIC RANK
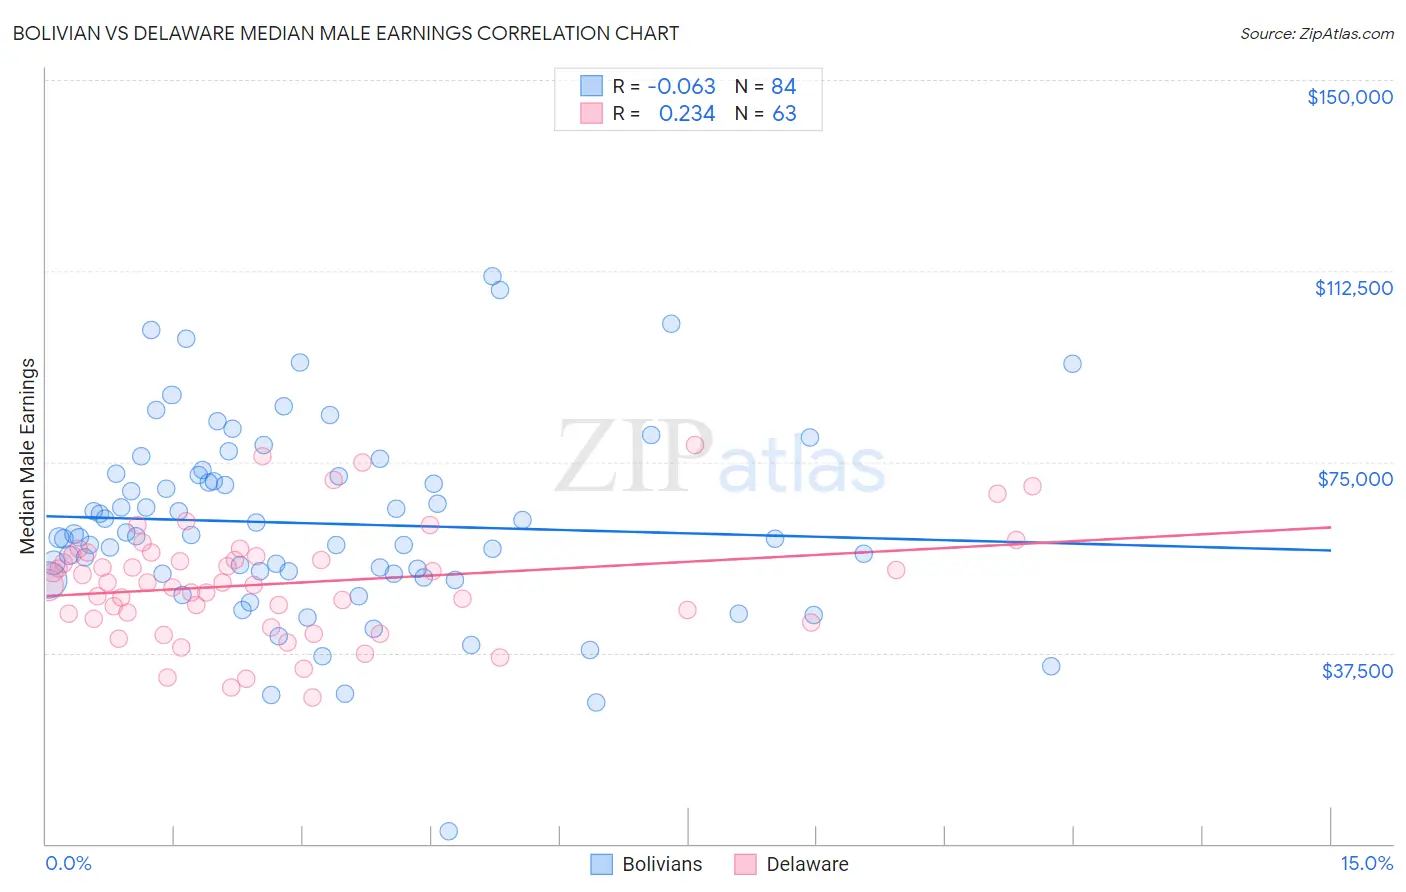
Bolivian vs Delaware Median Male Earnings Correlation Chart
The statistical analysis conducted on geographies consisting of 184,669,287 people shows a slight negative correlation between the proportion of Bolivians and median male earnings in the United States with a correlation coefficient (R) of -0.063 and weighted average of $61,066. Similarly, the statistical analysis conducted on geographies consisting of 96,215,096 people shows a weak positive correlation between the proportion of Delaware and median male earnings in the United States with a correlation coefficient (R) of 0.234 and weighted average of $52,412, a difference of 16.5%.
Median Male Earnings Correlation Summary
| Measurement | Bolivian | Delaware |
| Minimum | $2,499 | $28,768 |
| Maximum | $111,480 | $78,250 |
| Range | $108,981 | $49,482 |
| Mean | $62,895 | $51,144 |
| Median | $60,590 | $51,243 |
| Interquartile 25% (IQ1) | $53,011 | $44,148 |
| Interquartile 75% (IQ3) | $72,615 | $56,755 |
| Interquartile Range (IQR) | $19,604 | $12,606 |
| Standard Deviation (Sample) | $18,921 | $10,850 |
| Standard Deviation (Population) | $18,808 | $10,763 |
Similar Demographics by Median Male Earnings
Demographics Similar to Bolivians by Median Male Earnings
In terms of median male earnings, the demographic groups most similar to Bolivians are Immigrants from Romania ($61,040, a difference of 0.040%), Immigrants from Netherlands ($61,096, a difference of 0.050%), Egyptian ($61,095, a difference of 0.050%), Immigrants from Pakistan ($60,987, a difference of 0.13%), and Immigrants from Eastern Europe ($60,958, a difference of 0.18%).
| Demographics | Rating | Rank | Median Male Earnings |
| Immigrants | Latvia | 99.9 /100 | #54 | Exceptional $61,422 |
| Greeks | 99.9 /100 | #55 | Exceptional $61,242 |
| Lithuanians | 99.9 /100 | #56 | Exceptional $61,228 |
| Immigrants | Scotland | 99.9 /100 | #57 | Exceptional $61,220 |
| New Zealanders | 99.9 /100 | #58 | Exceptional $61,199 |
| Immigrants | Netherlands | 99.8 /100 | #59 | Exceptional $61,096 |
| Egyptians | 99.8 /100 | #60 | Exceptional $61,095 |
| Bolivians | 99.8 /100 | #61 | Exceptional $61,066 |
| Immigrants | Romania | 99.8 /100 | #62 | Exceptional $61,040 |
| Immigrants | Pakistan | 99.8 /100 | #63 | Exceptional $60,987 |
| Immigrants | Eastern Europe | 99.8 /100 | #64 | Exceptional $60,958 |
| Immigrants | Indonesia | 99.8 /100 | #65 | Exceptional $60,935 |
| Immigrants | Croatia | 99.8 /100 | #66 | Exceptional $60,914 |
| Immigrants | Spain | 99.8 /100 | #67 | Exceptional $60,750 |
| Immigrants | Serbia | 99.7 /100 | #68 | Exceptional $60,600 |
Demographics Similar to Delaware by Median Male Earnings
In terms of median male earnings, the demographic groups most similar to Delaware are Tlingit-Haida ($52,409, a difference of 0.010%), Bermudan ($52,465, a difference of 0.10%), Cajun ($52,325, a difference of 0.17%), Venezuelan ($52,510, a difference of 0.19%), and Native Hawaiian ($52,306, a difference of 0.20%).
| Demographics | Rating | Rank | Median Male Earnings |
| Panamanians | 16.5 /100 | #203 | Poor $52,835 |
| Ghanaians | 16.1 /100 | #204 | Poor $52,810 |
| Immigrants | Colombia | 15.0 /100 | #205 | Poor $52,725 |
| Immigrants | Iraq | 14.5 /100 | #206 | Poor $52,681 |
| Vietnamese | 12.7 /100 | #207 | Poor $52,525 |
| Venezuelans | 12.5 /100 | #208 | Poor $52,510 |
| Bermudans | 12.1 /100 | #209 | Poor $52,465 |
| Delaware | 11.5 /100 | #210 | Poor $52,412 |
| Tlingit-Haida | 11.5 /100 | #211 | Poor $52,409 |
| Cajuns | 10.7 /100 | #212 | Poor $52,325 |
| Native Hawaiians | 10.5 /100 | #213 | Poor $52,306 |
| Immigrants | Nonimmigrants | 9.3 /100 | #214 | Tragic $52,170 |
| Immigrants | Cameroon | 8.9 /100 | #215 | Tragic $52,119 |
| Immigrants | Venezuela | 8.3 /100 | #216 | Tragic $52,041 |
| Nigerians | 8.3 /100 | #217 | Tragic $52,039 |