Immigrants from South Africa vs Delaware Median Male Earnings
COMPARE
Immigrants from South Africa
Delaware
Median Male Earnings
Median Male Earnings Comparison
Immigrants from South Africa
Delaware
$62,899
MEDIAN MALE EARNINGS
100.0/ 100
METRIC RATING
39th/ 347
METRIC RANK
$52,412
MEDIAN MALE EARNINGS
11.5/ 100
METRIC RATING
210th/ 347
METRIC RANK
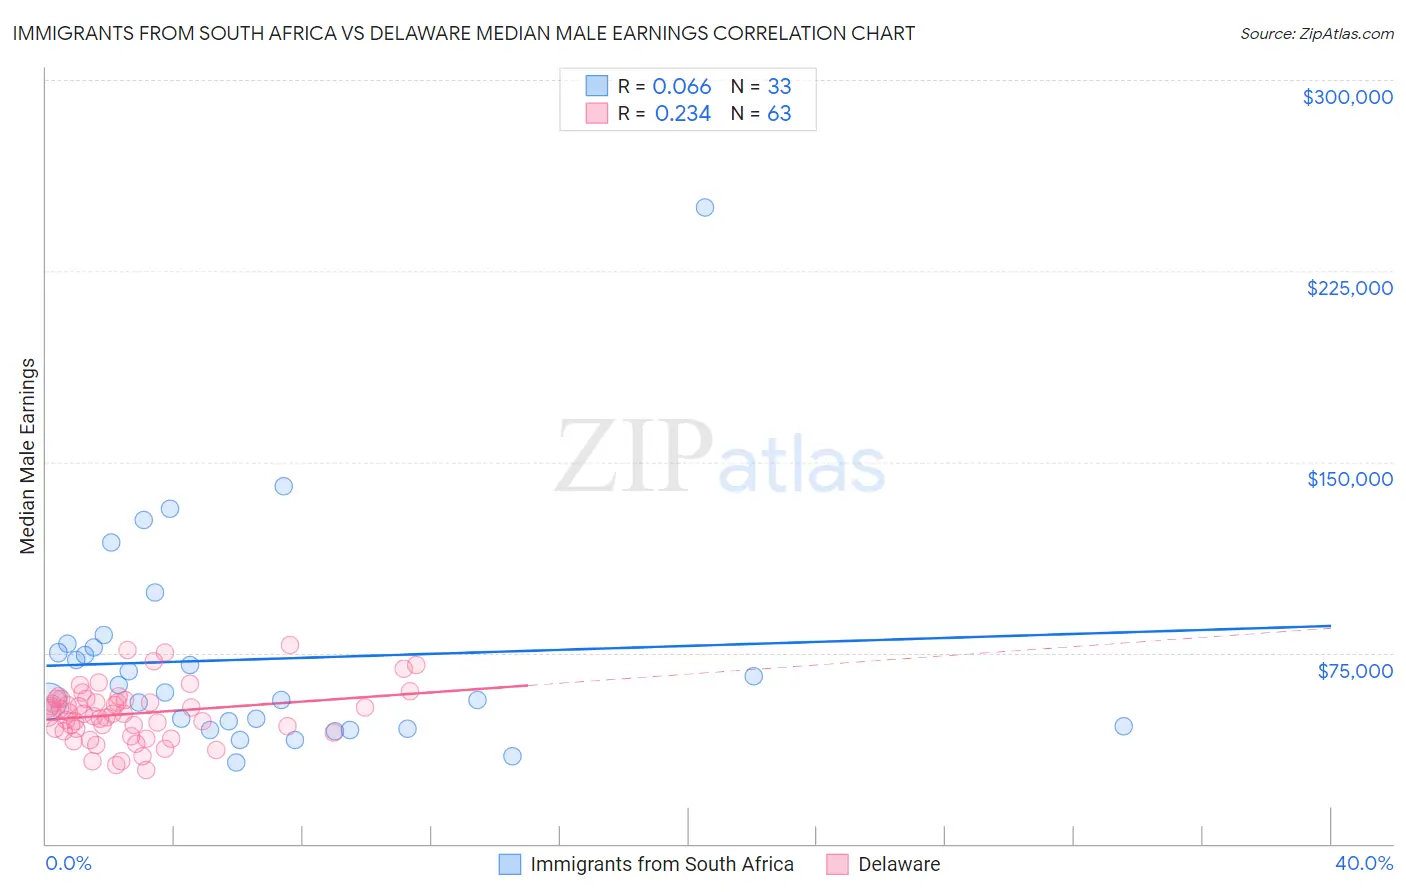
Immigrants from South Africa vs Delaware Median Male Earnings Correlation Chart
The statistical analysis conducted on geographies consisting of 233,272,809 people shows a slight positive correlation between the proportion of Immigrants from South Africa and median male earnings in the United States with a correlation coefficient (R) of 0.066 and weighted average of $62,899. Similarly, the statistical analysis conducted on geographies consisting of 96,215,096 people shows a weak positive correlation between the proportion of Delaware and median male earnings in the United States with a correlation coefficient (R) of 0.234 and weighted average of $52,412, a difference of 20.0%.
Median Male Earnings Correlation Summary
| Measurement | Immigrants from South Africa | Delaware |
| Minimum | $31,875 | $28,768 |
| Maximum | $250,001 | $78,250 |
| Range | $218,126 | $49,482 |
| Mean | $72,583 | $51,144 |
| Median | $59,605 | $51,243 |
| Interquartile 25% (IQ1) | $45,646 | $44,148 |
| Interquartile 75% (IQ3) | $77,820 | $56,755 |
| Interquartile Range (IQR) | $32,174 | $12,606 |
| Standard Deviation (Sample) | $42,392 | $10,850 |
| Standard Deviation (Population) | $41,745 | $10,763 |
Similar Demographics by Median Male Earnings
Demographics Similar to Immigrants from South Africa by Median Male Earnings
In terms of median male earnings, the demographic groups most similar to Immigrants from South Africa are Australian ($62,857, a difference of 0.070%), Maltese ($62,953, a difference of 0.090%), Immigrants from Turkey ($62,728, a difference of 0.27%), Immigrants from Sri Lanka ($63,099, a difference of 0.32%), and Immigrants from Greece ($62,689, a difference of 0.34%).
| Demographics | Rating | Rank | Median Male Earnings |
| Soviet Union | 100.0 /100 | #32 | Exceptional $63,382 |
| Immigrants | Lithuania | 100.0 /100 | #33 | Exceptional $63,346 |
| Immigrants | Russia | 100.0 /100 | #34 | Exceptional $63,326 |
| Immigrants | Asia | 100.0 /100 | #35 | Exceptional $63,240 |
| Israelis | 100.0 /100 | #36 | Exceptional $63,228 |
| Immigrants | Sri Lanka | 100.0 /100 | #37 | Exceptional $63,099 |
| Maltese | 100.0 /100 | #38 | Exceptional $62,953 |
| Immigrants | South Africa | 100.0 /100 | #39 | Exceptional $62,899 |
| Australians | 100.0 /100 | #40 | Exceptional $62,857 |
| Immigrants | Turkey | 100.0 /100 | #41 | Exceptional $62,728 |
| Immigrants | Greece | 100.0 /100 | #42 | Exceptional $62,689 |
| Immigrants | Belarus | 100.0 /100 | #43 | Exceptional $62,658 |
| Cambodians | 100.0 /100 | #44 | Exceptional $62,516 |
| Bulgarians | 100.0 /100 | #45 | Exceptional $62,378 |
| Immigrants | Czechoslovakia | 99.9 /100 | #46 | Exceptional $62,217 |
Demographics Similar to Delaware by Median Male Earnings
In terms of median male earnings, the demographic groups most similar to Delaware are Tlingit-Haida ($52,409, a difference of 0.010%), Bermudan ($52,465, a difference of 0.10%), Cajun ($52,325, a difference of 0.17%), Venezuelan ($52,510, a difference of 0.19%), and Native Hawaiian ($52,306, a difference of 0.20%).
| Demographics | Rating | Rank | Median Male Earnings |
| Panamanians | 16.5 /100 | #203 | Poor $52,835 |
| Ghanaians | 16.1 /100 | #204 | Poor $52,810 |
| Immigrants | Colombia | 15.0 /100 | #205 | Poor $52,725 |
| Immigrants | Iraq | 14.5 /100 | #206 | Poor $52,681 |
| Vietnamese | 12.7 /100 | #207 | Poor $52,525 |
| Venezuelans | 12.5 /100 | #208 | Poor $52,510 |
| Bermudans | 12.1 /100 | #209 | Poor $52,465 |
| Delaware | 11.5 /100 | #210 | Poor $52,412 |
| Tlingit-Haida | 11.5 /100 | #211 | Poor $52,409 |
| Cajuns | 10.7 /100 | #212 | Poor $52,325 |
| Native Hawaiians | 10.5 /100 | #213 | Poor $52,306 |
| Immigrants | Nonimmigrants | 9.3 /100 | #214 | Tragic $52,170 |
| Immigrants | Cameroon | 8.9 /100 | #215 | Tragic $52,119 |
| Immigrants | Venezuela | 8.3 /100 | #216 | Tragic $52,041 |
| Nigerians | 8.3 /100 | #217 | Tragic $52,039 |