Mongolian vs Immigrants from South Africa Householder Income Ages 45 - 64 years
COMPARE
Mongolian
Immigrants from South Africa
Householder Income Ages 45 - 64 years
Householder Income Ages 45 - 64 years Comparison
Mongolians
Immigrants from South Africa
$111,602
HOUSEHOLDER INCOME AGES 45 - 64 YEARS
99.6/ 100
METRIC RATING
63rd/ 347
METRIC RANK
$112,886
HOUSEHOLDER INCOME AGES 45 - 64 YEARS
99.8/ 100
METRIC RATING
51st/ 347
METRIC RANK
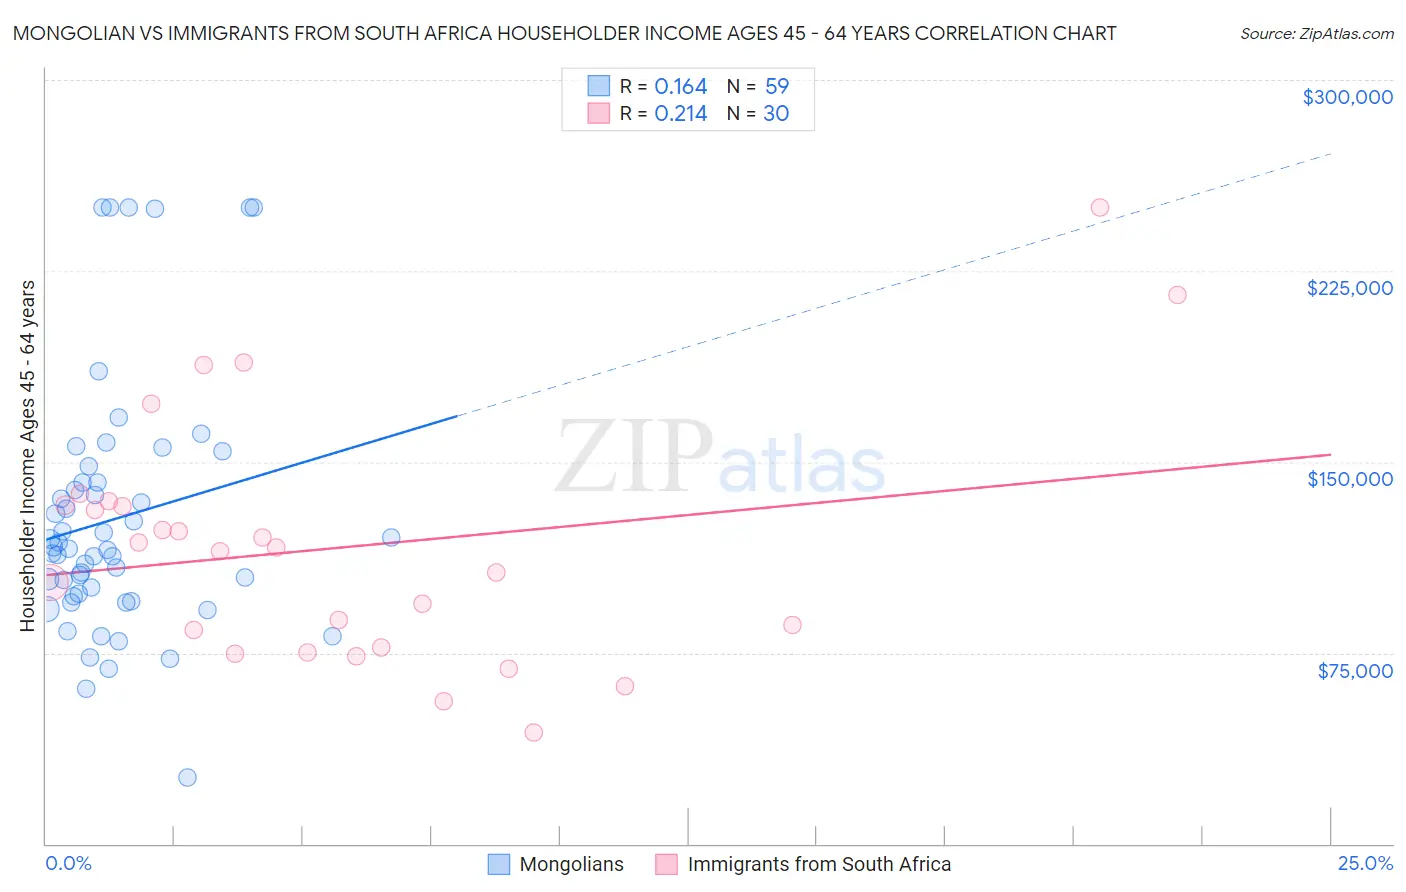
Mongolian vs Immigrants from South Africa Householder Income Ages 45 - 64 years Correlation Chart
The statistical analysis conducted on geographies consisting of 140,216,470 people shows a poor positive correlation between the proportion of Mongolians and household income with householder between the ages 45 and 64 in the United States with a correlation coefficient (R) of 0.164 and weighted average of $111,602. Similarly, the statistical analysis conducted on geographies consisting of 233,154,360 people shows a weak positive correlation between the proportion of Immigrants from South Africa and household income with householder between the ages 45 and 64 in the United States with a correlation coefficient (R) of 0.214 and weighted average of $112,886, a difference of 1.1%.
Householder Income Ages 45 - 64 years Correlation Summary
| Measurement | Mongolian | Immigrants from South Africa |
| Minimum | $25,952 | $43,750 |
| Maximum | $250,001 | $250,001 |
| Range | $224,049 | $206,251 |
| Mean | $127,849 | $116,416 |
| Median | $115,953 | $115,780 |
| Interquartile 25% (IQ1) | $97,273 | $77,125 |
| Interquartile 75% (IQ3) | $142,123 | $133,043 |
| Interquartile Range (IQR) | $44,850 | $55,918 |
| Standard Deviation (Sample) | $50,162 | $48,210 |
| Standard Deviation (Population) | $49,735 | $47,400 |
Demographics Similar to Mongolians and Immigrants from South Africa by Householder Income Ages 45 - 64 years
In terms of householder income ages 45 - 64 years, the demographic groups most similar to Mongolians are Immigrants from Norway ($111,669, a difference of 0.060%), Immigrants from Latvia ($111,454, a difference of 0.13%), Immigrants from Belarus ($111,430, a difference of 0.15%), Immigrants from Czechoslovakia ($111,914, a difference of 0.28%), and New Zealander ($111,286, a difference of 0.28%). Similarly, the demographic groups most similar to Immigrants from South Africa are Immigrants from Malaysia ($112,796, a difference of 0.080%), Afghan ($112,676, a difference of 0.19%), Immigrants from Austria ($113,140, a difference of 0.22%), Greek ($112,630, a difference of 0.23%), and Immigrants from Russia ($113,215, a difference of 0.29%).
| Demographics | Rating | Rank | Householder Income Ages 45 - 64 years |
| Australians | 99.9 /100 | #47 | Exceptional $113,533 |
| Immigrants | Indonesia | 99.9 /100 | #48 | Exceptional $113,519 |
| Immigrants | Russia | 99.8 /100 | #49 | Exceptional $113,215 |
| Immigrants | Austria | 99.8 /100 | #50 | Exceptional $113,140 |
| Immigrants | South Africa | 99.8 /100 | #51 | Exceptional $112,886 |
| Immigrants | Malaysia | 99.8 /100 | #52 | Exceptional $112,796 |
| Afghans | 99.8 /100 | #53 | Exceptional $112,676 |
| Greeks | 99.8 /100 | #54 | Exceptional $112,630 |
| Lithuanians | 99.8 /100 | #55 | Exceptional $112,484 |
| Egyptians | 99.7 /100 | #56 | Exceptional $112,256 |
| Immigrants | Scotland | 99.7 /100 | #57 | Exceptional $112,175 |
| Soviet Union | 99.7 /100 | #58 | Exceptional $112,008 |
| Immigrants | Europe | 99.7 /100 | #59 | Exceptional $111,984 |
| Immigrants | Netherlands | 99.7 /100 | #60 | Exceptional $111,982 |
| Immigrants | Czechoslovakia | 99.7 /100 | #61 | Exceptional $111,914 |
| Immigrants | Norway | 99.7 /100 | #62 | Exceptional $111,669 |
| Mongolians | 99.6 /100 | #63 | Exceptional $111,602 |
| Immigrants | Latvia | 99.6 /100 | #64 | Exceptional $111,454 |
| Immigrants | Belarus | 99.6 /100 | #65 | Exceptional $111,430 |
| New Zealanders | 99.6 /100 | #66 | Exceptional $111,286 |
| Laotians | 99.5 /100 | #67 | Exceptional $111,051 |