Mongolian vs Immigrants from Ukraine Median Household Income
COMPARE
Mongolian
Immigrants from Ukraine
Median Household Income
Median Household Income Comparison
Mongolians
Immigrants from Ukraine
$93,971
MEDIAN HOUSEHOLD INCOME
99.7/ 100
METRIC RATING
68th/ 347
METRIC RANK
$91,124
MEDIAN HOUSEHOLD INCOME
98.0/ 100
METRIC RATING
103rd/ 347
METRIC RANK
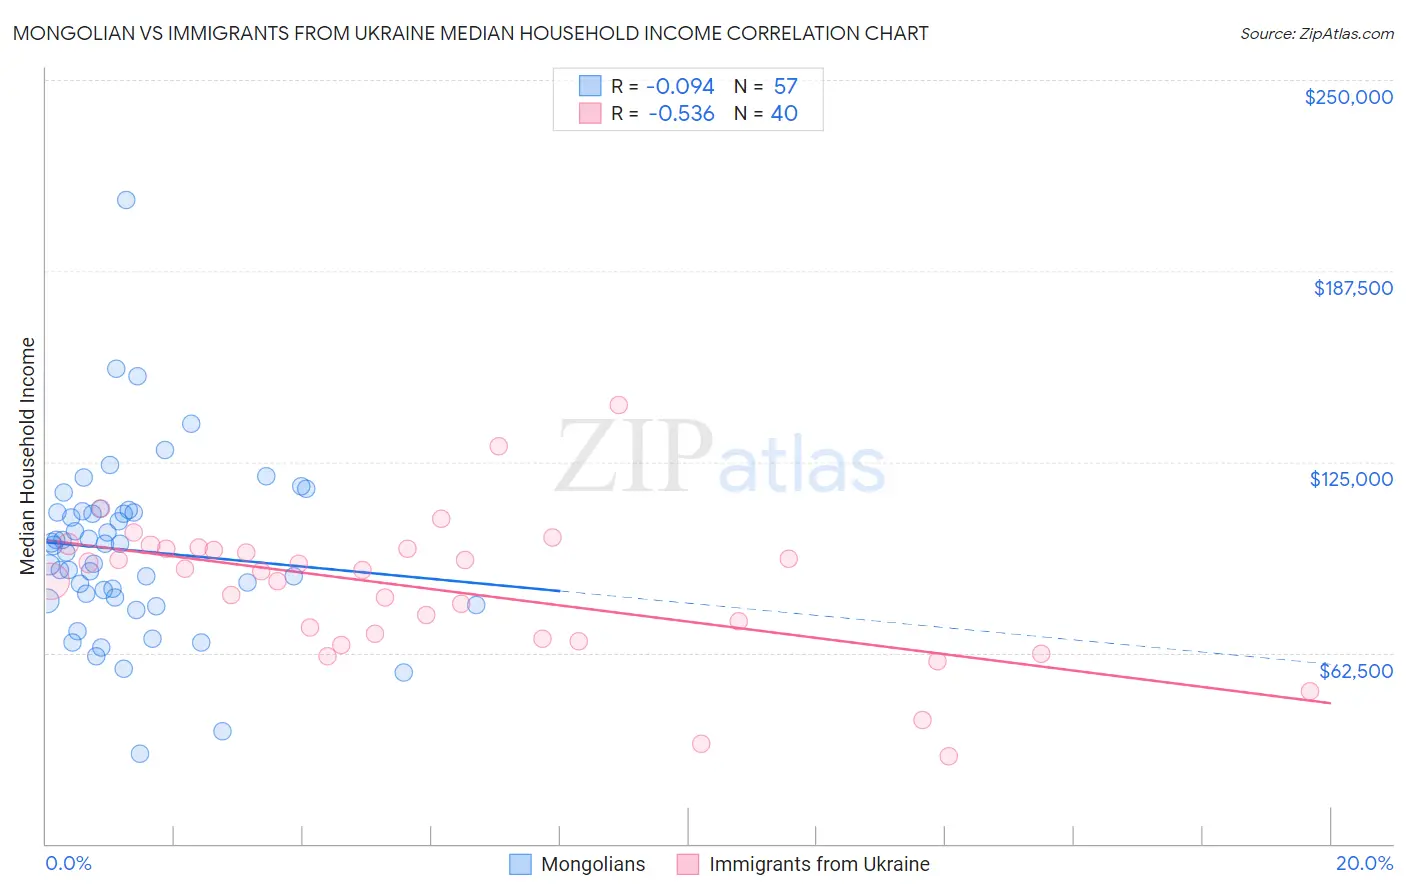
Mongolian vs Immigrants from Ukraine Median Household Income Correlation Chart
The statistical analysis conducted on geographies consisting of 140,276,403 people shows a slight negative correlation between the proportion of Mongolians and median household income in the United States with a correlation coefficient (R) of -0.094 and weighted average of $93,971. Similarly, the statistical analysis conducted on geographies consisting of 289,588,656 people shows a substantial negative correlation between the proportion of Immigrants from Ukraine and median household income in the United States with a correlation coefficient (R) of -0.536 and weighted average of $91,124, a difference of 3.1%.
Median Household Income Correlation Summary
| Measurement | Mongolian | Immigrants from Ukraine |
| Minimum | $29,643 | $28,750 |
| Maximum | $210,785 | $143,440 |
| Range | $181,142 | $114,690 |
| Mean | $96,039 | $83,370 |
| Median | $97,648 | $89,400 |
| Interquartile 25% (IQ1) | $79,996 | $67,859 |
| Interquartile 75% (IQ3) | $108,680 | $96,595 |
| Interquartile Range (IQR) | $28,684 | $28,737 |
| Standard Deviation (Sample) | $28,830 | $23,179 |
| Standard Deviation (Population) | $28,576 | $22,887 |
Similar Demographics by Median Household Income
Demographics Similar to Mongolians by Median Household Income
In terms of median household income, the demographic groups most similar to Mongolians are Argentinean ($93,960, a difference of 0.010%), Immigrants from Fiji ($93,933, a difference of 0.040%), Immigrants from Philippines ($93,899, a difference of 0.080%), Immigrants from Scotland ($94,091, a difference of 0.13%), and Lithuanian ($93,852, a difference of 0.13%).
| Demographics | Rating | Rank | Median Household Income |
| Laotians | 99.8 /100 | #61 | Exceptional $94,990 |
| Immigrants | Norway | 99.8 /100 | #62 | Exceptional $94,846 |
| Greeks | 99.8 /100 | #63 | Exceptional $94,735 |
| Immigrants | Netherlands | 99.7 /100 | #64 | Exceptional $94,411 |
| Immigrants | Belarus | 99.7 /100 | #65 | Exceptional $94,399 |
| Immigrants | Romania | 99.7 /100 | #66 | Exceptional $94,222 |
| Immigrants | Scotland | 99.7 /100 | #67 | Exceptional $94,091 |
| Mongolians | 99.7 /100 | #68 | Exceptional $93,971 |
| Argentineans | 99.7 /100 | #69 | Exceptional $93,960 |
| Immigrants | Fiji | 99.7 /100 | #70 | Exceptional $93,933 |
| Immigrants | Philippines | 99.6 /100 | #71 | Exceptional $93,899 |
| Lithuanians | 99.6 /100 | #72 | Exceptional $93,852 |
| Immigrants | Egypt | 99.6 /100 | #73 | Exceptional $93,700 |
| Immigrants | Latvia | 99.6 /100 | #74 | Exceptional $93,602 |
| Immigrants | Italy | 99.5 /100 | #75 | Exceptional $93,465 |
Demographics Similar to Immigrants from Ukraine by Median Household Income
In terms of median household income, the demographic groups most similar to Immigrants from Ukraine are Immigrants from Kazakhstan ($91,015, a difference of 0.12%), Austrian ($91,339, a difference of 0.24%), Immigrants from Brazil ($90,907, a difference of 0.24%), Immigrants from Moldova ($91,446, a difference of 0.35%), and Ukrainian ($91,456, a difference of 0.36%).
| Demographics | Rating | Rank | Median Household Income |
| Jordanians | 98.7 /100 | #96 | Exceptional $91,794 |
| Immigrants | Serbia | 98.6 /100 | #97 | Exceptional $91,730 |
| Immigrants | Southern Europe | 98.5 /100 | #98 | Exceptional $91,605 |
| Immigrants | South Eastern Asia | 98.4 /100 | #99 | Exceptional $91,541 |
| Ukrainians | 98.3 /100 | #100 | Exceptional $91,456 |
| Immigrants | Moldova | 98.3 /100 | #101 | Exceptional $91,446 |
| Austrians | 98.2 /100 | #102 | Exceptional $91,339 |
| Immigrants | Ukraine | 98.0 /100 | #103 | Exceptional $91,124 |
| Immigrants | Kazakhstan | 97.8 /100 | #104 | Exceptional $91,015 |
| Immigrants | Brazil | 97.7 /100 | #105 | Exceptional $90,907 |
| Macedonians | 97.4 /100 | #106 | Exceptional $90,761 |
| Croatians | 97.3 /100 | #107 | Exceptional $90,685 |
| Zimbabweans | 97.2 /100 | #108 | Exceptional $90,618 |
| Chileans | 97.2 /100 | #109 | Exceptional $90,605 |
| Palestinians | 97.1 /100 | #110 | Exceptional $90,574 |