Mongolian vs Argentinean Median Household Income
COMPARE
Mongolian
Argentinean
Median Household Income
Median Household Income Comparison
Mongolians
Argentineans
$93,971
MEDIAN HOUSEHOLD INCOME
99.7/ 100
METRIC RATING
68th/ 347
METRIC RANK
$93,960
MEDIAN HOUSEHOLD INCOME
99.7/ 100
METRIC RATING
69th/ 347
METRIC RANK
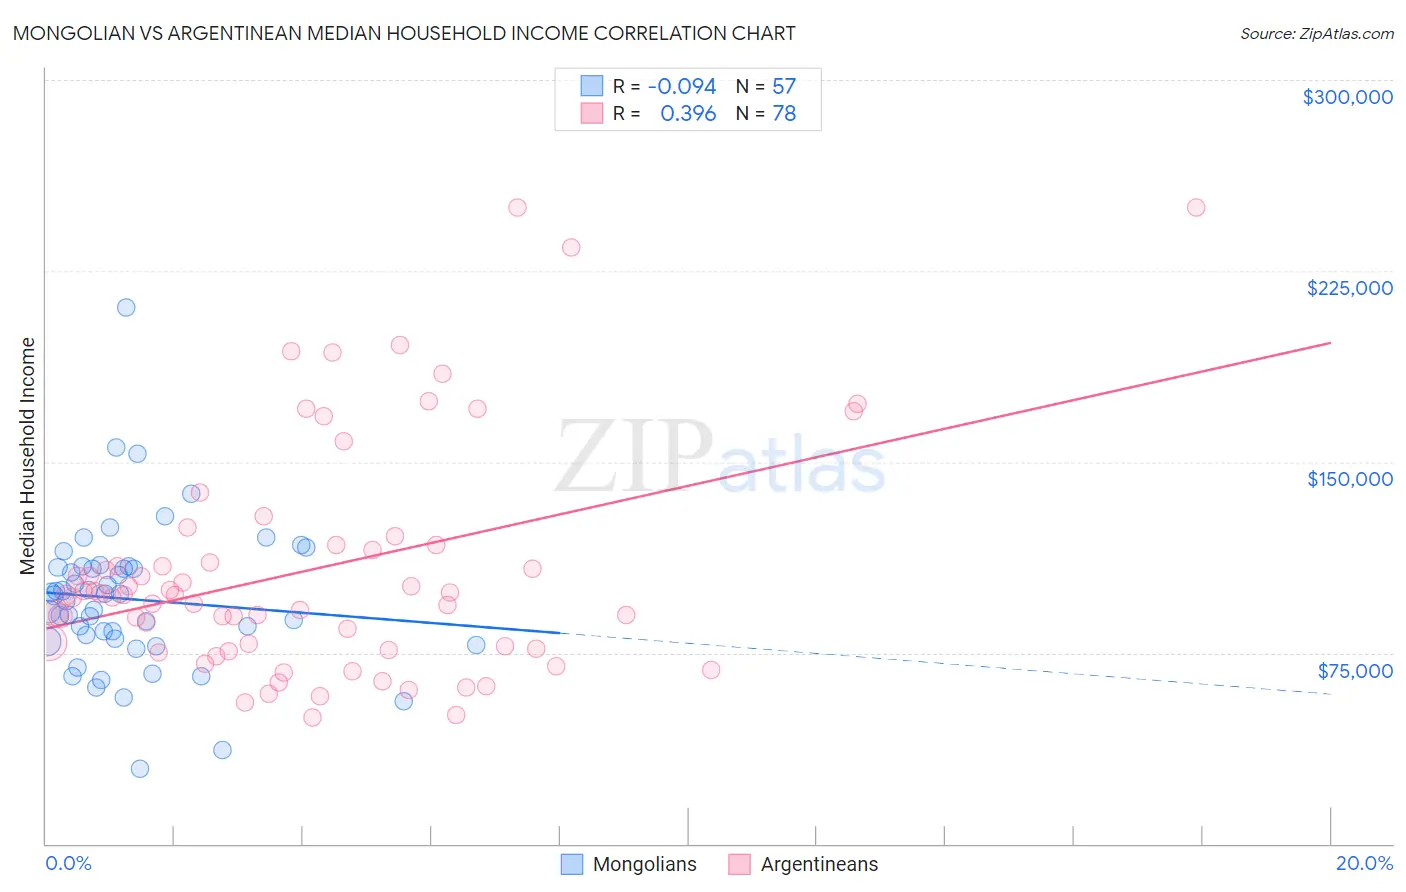
Mongolian vs Argentinean Median Household Income Correlation Chart
The statistical analysis conducted on geographies consisting of 140,276,403 people shows a slight negative correlation between the proportion of Mongolians and median household income in the United States with a correlation coefficient (R) of -0.094 and weighted average of $93,971. Similarly, the statistical analysis conducted on geographies consisting of 296,944,042 people shows a mild positive correlation between the proportion of Argentineans and median household income in the United States with a correlation coefficient (R) of 0.396 and weighted average of $93,960, a difference of 0.010%.
Median Household Income Correlation Summary
| Measurement | Mongolian | Argentinean |
| Minimum | $29,643 | $49,375 |
| Maximum | $210,785 | $250,001 |
| Range | $181,142 | $200,626 |
| Mean | $96,039 | $107,782 |
| Median | $97,648 | $97,608 |
| Interquartile 25% (IQ1) | $79,996 | $76,750 |
| Interquartile 75% (IQ3) | $108,680 | $117,422 |
| Interquartile Range (IQR) | $28,684 | $40,672 |
| Standard Deviation (Sample) | $28,830 | $45,385 |
| Standard Deviation (Population) | $28,576 | $45,093 |
Demographics Similar to Mongolians and Argentineans by Median Household Income
In terms of median household income, the demographic groups most similar to Mongolians are Immigrants from Fiji ($93,933, a difference of 0.040%), Immigrants from Philippines ($93,899, a difference of 0.080%), Immigrants from Scotland ($94,091, a difference of 0.13%), Lithuanian ($93,852, a difference of 0.13%), and Immigrants from Romania ($94,222, a difference of 0.27%). Similarly, the demographic groups most similar to Argentineans are Immigrants from Fiji ($93,933, a difference of 0.030%), Immigrants from Philippines ($93,899, a difference of 0.070%), Lithuanian ($93,852, a difference of 0.11%), Immigrants from Scotland ($94,091, a difference of 0.14%), and Immigrants from Romania ($94,222, a difference of 0.28%).
| Demographics | Rating | Rank | Median Household Income |
| Soviet Union | 99.8 /100 | #58 | Exceptional $95,098 |
| Immigrants | Europe | 99.8 /100 | #59 | Exceptional $95,032 |
| Koreans | 99.8 /100 | #60 | Exceptional $95,018 |
| Laotians | 99.8 /100 | #61 | Exceptional $94,990 |
| Immigrants | Norway | 99.8 /100 | #62 | Exceptional $94,846 |
| Greeks | 99.8 /100 | #63 | Exceptional $94,735 |
| Immigrants | Netherlands | 99.7 /100 | #64 | Exceptional $94,411 |
| Immigrants | Belarus | 99.7 /100 | #65 | Exceptional $94,399 |
| Immigrants | Romania | 99.7 /100 | #66 | Exceptional $94,222 |
| Immigrants | Scotland | 99.7 /100 | #67 | Exceptional $94,091 |
| Mongolians | 99.7 /100 | #68 | Exceptional $93,971 |
| Argentineans | 99.7 /100 | #69 | Exceptional $93,960 |
| Immigrants | Fiji | 99.7 /100 | #70 | Exceptional $93,933 |
| Immigrants | Philippines | 99.6 /100 | #71 | Exceptional $93,899 |
| Lithuanians | 99.6 /100 | #72 | Exceptional $93,852 |
| Immigrants | Egypt | 99.6 /100 | #73 | Exceptional $93,700 |
| Immigrants | Latvia | 99.6 /100 | #74 | Exceptional $93,602 |
| Immigrants | Italy | 99.5 /100 | #75 | Exceptional $93,465 |
| South Africans | 99.5 /100 | #76 | Exceptional $93,379 |
| Immigrants | Afghanistan | 99.5 /100 | #77 | Exceptional $93,375 |
| Immigrants | Bulgaria | 99.4 /100 | #78 | Exceptional $93,148 |