Mexican vs Immigrants from Chile Median Household Income
COMPARE
Mexican
Immigrants from Chile
Median Household Income
Median Household Income Comparison
Mexicans
Immigrants from Chile
$74,399
MEDIAN HOUSEHOLD INCOME
0.1/ 100
METRIC RATING
285th/ 347
METRIC RANK
$88,388
MEDIAN HOUSEHOLD INCOME
89.2/ 100
METRIC RATING
139th/ 347
METRIC RANK
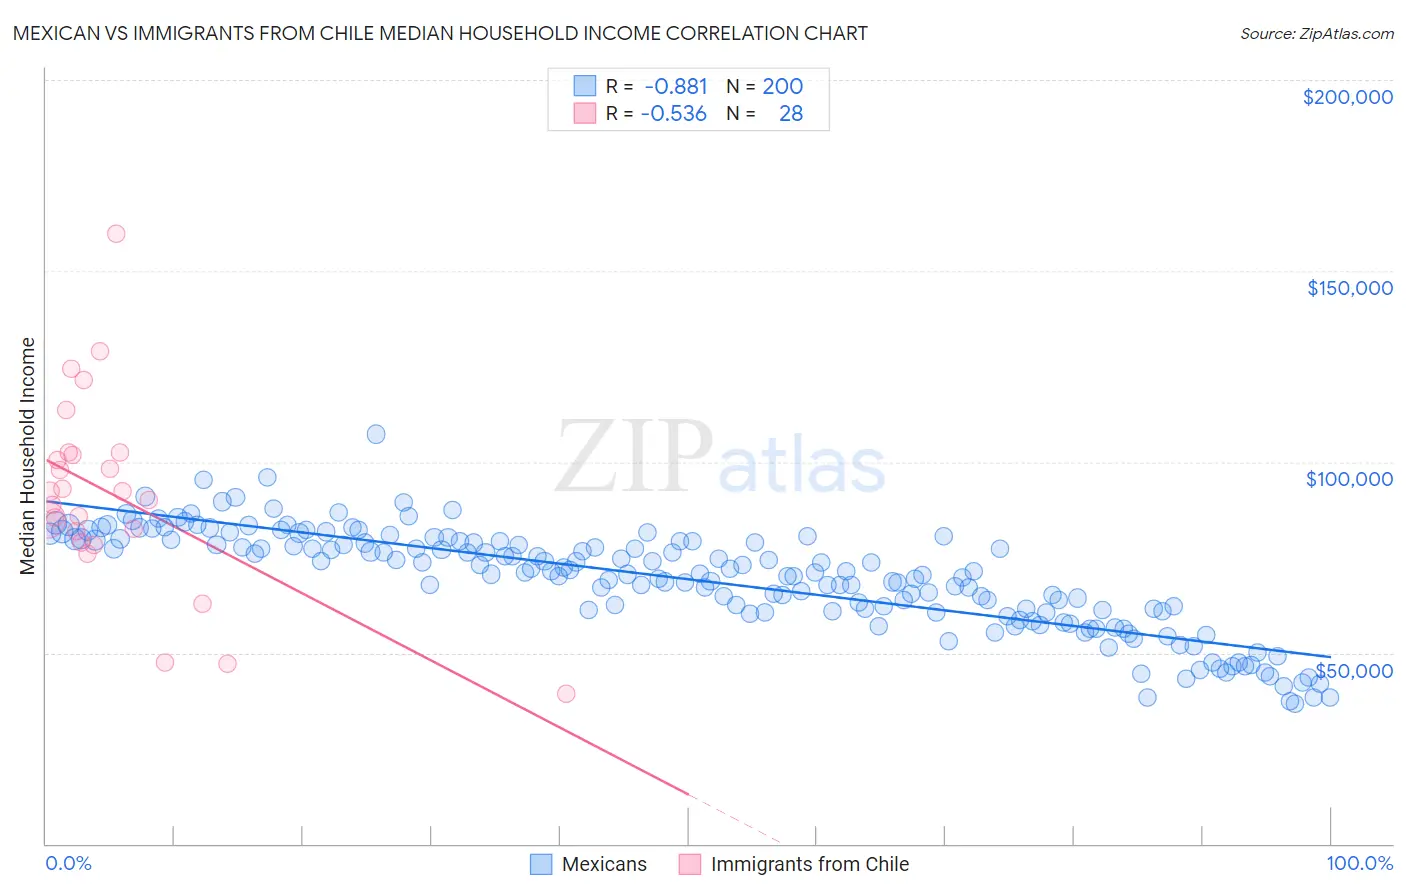
Mexican vs Immigrants from Chile Median Household Income Correlation Chart
The statistical analysis conducted on geographies consisting of 564,134,448 people shows a very strong negative correlation between the proportion of Mexicans and median household income in the United States with a correlation coefficient (R) of -0.881 and weighted average of $74,399. Similarly, the statistical analysis conducted on geographies consisting of 218,579,752 people shows a substantial negative correlation between the proportion of Immigrants from Chile and median household income in the United States with a correlation coefficient (R) of -0.536 and weighted average of $88,388, a difference of 18.8%.
Median Household Income Correlation Summary
| Measurement | Mexican | Immigrants from Chile |
| Minimum | $36,747 | $39,375 |
| Maximum | $107,254 | $159,688 |
| Range | $70,506 | $120,313 |
| Mean | $69,252 | $91,361 |
| Median | $71,107 | $91,251 |
| Interquartile 25% (IQ1) | $60,819 | $80,247 |
| Interquartile 75% (IQ3) | $79,357 | $102,116 |
| Interquartile Range (IQR) | $18,537 | $21,868 |
| Standard Deviation (Sample) | $13,393 | $25,347 |
| Standard Deviation (Population) | $13,359 | $24,890 |
Similar Demographics by Median Household Income
Demographics Similar to Mexicans by Median Household Income
In terms of median household income, the demographic groups most similar to Mexicans are Immigrants from Somalia ($74,300, a difference of 0.13%), Iroquois ($74,279, a difference of 0.16%), Immigrants from Central America ($74,217, a difference of 0.24%), Yaqui ($74,596, a difference of 0.26%), and Fijian ($74,205, a difference of 0.26%).
| Demographics | Rating | Rank | Median Household Income |
| Osage | 0.2 /100 | #278 | Tragic $75,240 |
| Immigrants | Guatemala | 0.2 /100 | #279 | Tragic $75,123 |
| Senegalese | 0.2 /100 | #280 | Tragic $74,999 |
| Immigrants | Liberia | 0.1 /100 | #281 | Tragic $74,896 |
| Central American Indians | 0.1 /100 | #282 | Tragic $74,847 |
| Cree | 0.1 /100 | #283 | Tragic $74,685 |
| Yaqui | 0.1 /100 | #284 | Tragic $74,596 |
| Mexicans | 0.1 /100 | #285 | Tragic $74,399 |
| Immigrants | Somalia | 0.1 /100 | #286 | Tragic $74,300 |
| Iroquois | 0.1 /100 | #287 | Tragic $74,279 |
| Immigrants | Central America | 0.1 /100 | #288 | Tragic $74,217 |
| Fijians | 0.1 /100 | #289 | Tragic $74,205 |
| Bangladeshis | 0.1 /100 | #290 | Tragic $74,112 |
| Hispanics or Latinos | 0.1 /100 | #291 | Tragic $73,823 |
| Comanche | 0.1 /100 | #292 | Tragic $73,747 |
Demographics Similar to Immigrants from Chile by Median Household Income
In terms of median household income, the demographic groups most similar to Immigrants from Chile are Arab ($88,398, a difference of 0.010%), Sierra Leonean ($88,463, a difference of 0.080%), Polish ($88,472, a difference of 0.090%), Immigrants from Sierra Leone ($88,498, a difference of 0.12%), and Swedish ($88,524, a difference of 0.15%).
| Demographics | Rating | Rank | Median Household Income |
| Europeans | 91.2 /100 | #132 | Exceptional $88,751 |
| Immigrants | Ethiopia | 90.9 /100 | #133 | Exceptional $88,687 |
| Swedes | 90.0 /100 | #134 | Exceptional $88,524 |
| Immigrants | Sierra Leone | 89.9 /100 | #135 | Excellent $88,498 |
| Poles | 89.7 /100 | #136 | Excellent $88,472 |
| Sierra Leoneans | 89.6 /100 | #137 | Excellent $88,463 |
| Arabs | 89.2 /100 | #138 | Excellent $88,398 |
| Immigrants | Chile | 89.2 /100 | #139 | Excellent $88,388 |
| Lebanese | 87.2 /100 | #140 | Excellent $88,091 |
| Immigrants | Morocco | 86.0 /100 | #141 | Excellent $87,930 |
| Canadians | 84.7 /100 | #142 | Excellent $87,769 |
| Danes | 83.9 /100 | #143 | Excellent $87,676 |
| Serbians | 83.0 /100 | #144 | Excellent $87,572 |
| Ugandans | 82.9 /100 | #145 | Excellent $87,557 |
| Immigrants | Uganda | 82.8 /100 | #146 | Excellent $87,553 |