Mexican vs Ottawa Single Male Poverty
COMPARE
Mexican
Ottawa
Single Male Poverty
Single Male Poverty Comparison
Mexicans
Ottawa
14.0%
SINGLE MALE POVERTY
0.1/ 100
METRIC RATING
272nd/ 347
METRIC RANK
14.6%
SINGLE MALE POVERTY
0.0/ 100
METRIC RATING
294th/ 347
METRIC RANK
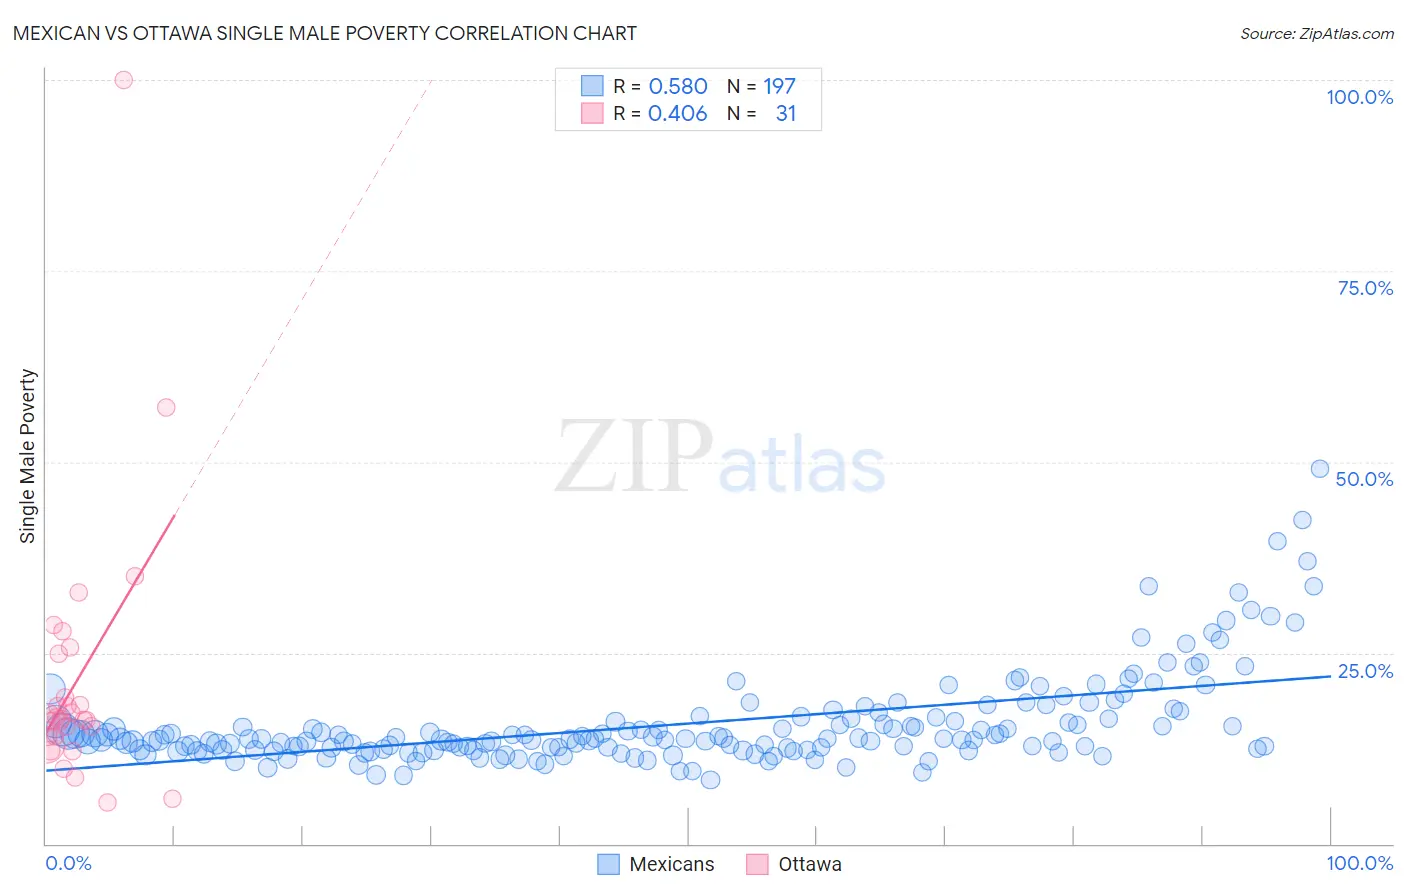
Mexican vs Ottawa Single Male Poverty Correlation Chart
The statistical analysis conducted on geographies consisting of 471,672,286 people shows a substantial positive correlation between the proportion of Mexicans and poverty level among single males in the United States with a correlation coefficient (R) of 0.580 and weighted average of 14.0%. Similarly, the statistical analysis conducted on geographies consisting of 47,840,673 people shows a moderate positive correlation between the proportion of Ottawa and poverty level among single males in the United States with a correlation coefficient (R) of 0.406 and weighted average of 14.6%, a difference of 4.5%.
Single Male Poverty Correlation Summary
| Measurement | Mexican | Ottawa |
| Minimum | 8.4% | 5.4% |
| Maximum | 49.1% | 100.0% |
| Range | 40.7% | 94.6% |
| Mean | 15.6% | 21.4% |
| Median | 13.7% | 16.3% |
| Interquartile 25% (IQ1) | 12.3% | 14.0% |
| Interquartile 75% (IQ3) | 16.2% | 24.9% |
| Interquartile Range (IQR) | 3.9% | 10.9% |
| Standard Deviation (Sample) | 6.1% | 17.7% |
| Standard Deviation (Population) | 6.1% | 17.4% |
Similar Demographics by Single Male Poverty
Demographics Similar to Mexicans by Single Male Poverty
In terms of single male poverty, the demographic groups most similar to Mexicans are Irish (14.0%, a difference of 0.060%), Immigrants from Saudi Arabia (14.0%, a difference of 0.090%), Scottish (14.0%, a difference of 0.10%), Immigrants from Mexico (13.9%, a difference of 0.26%), and German (13.9%, a difference of 0.33%).
| Demographics | Rating | Rank | Single Male Poverty |
| Immigrants | Congo | 0.2 /100 | #265 | Tragic 13.9% |
| Immigrants | Cabo Verde | 0.1 /100 | #266 | Tragic 13.9% |
| Germans | 0.1 /100 | #267 | Tragic 13.9% |
| Immigrants | Mexico | 0.1 /100 | #268 | Tragic 13.9% |
| Scottish | 0.1 /100 | #269 | Tragic 14.0% |
| Immigrants | Saudi Arabia | 0.1 /100 | #270 | Tragic 14.0% |
| Irish | 0.1 /100 | #271 | Tragic 14.0% |
| Mexicans | 0.1 /100 | #272 | Tragic 14.0% |
| Welsh | 0.1 /100 | #273 | Tragic 14.0% |
| Hondurans | 0.1 /100 | #274 | Tragic 14.0% |
| English | 0.1 /100 | #275 | Tragic 14.1% |
| Dutch | 0.1 /100 | #276 | Tragic 14.1% |
| Immigrants | Honduras | 0.0 /100 | #277 | Tragic 14.1% |
| Slovaks | 0.0 /100 | #278 | Tragic 14.1% |
| Indonesians | 0.0 /100 | #279 | Tragic 14.1% |
Demographics Similar to Ottawa by Single Male Poverty
In terms of single male poverty, the demographic groups most similar to Ottawa are French Canadian (14.6%, a difference of 0.19%), Nonimmigrants (14.6%, a difference of 0.30%), Bahamian (14.6%, a difference of 0.43%), Scotch-Irish (14.7%, a difference of 0.44%), and U.S. Virgin Islander (14.5%, a difference of 0.59%).
| Demographics | Rating | Rank | Single Male Poverty |
| Iroquois | 0.0 /100 | #287 | Tragic 14.5% |
| Whites/Caucasians | 0.0 /100 | #288 | Tragic 14.5% |
| Immigrants | Dominica | 0.0 /100 | #289 | Tragic 14.5% |
| U.S. Virgin Islanders | 0.0 /100 | #290 | Tragic 14.5% |
| Bahamians | 0.0 /100 | #291 | Tragic 14.6% |
| Immigrants | Nonimmigrants | 0.0 /100 | #292 | Tragic 14.6% |
| French Canadians | 0.0 /100 | #293 | Tragic 14.6% |
| Ottawa | 0.0 /100 | #294 | Tragic 14.6% |
| Scotch-Irish | 0.0 /100 | #295 | Tragic 14.7% |
| Africans | 0.0 /100 | #296 | Tragic 14.7% |
| Immigrants | Dominican Republic | 0.0 /100 | #297 | Tragic 14.8% |
| French American Indians | 0.0 /100 | #298 | Tragic 15.0% |
| Delaware | 0.0 /100 | #299 | Tragic 15.0% |
| Cree | 0.0 /100 | #300 | Tragic 15.1% |
| Dominicans | 0.0 /100 | #301 | Tragic 15.2% |