Mexican vs Immigrants from Sri Lanka Householder Income Ages 25 - 44 years
COMPARE
Mexican
Immigrants from Sri Lanka
Householder Income Ages 25 - 44 years
Householder Income Ages 25 - 44 years Comparison
Mexicans
Immigrants from Sri Lanka
$80,427
HOUSEHOLDER INCOME AGES 25 - 44 YEARS
0.0/ 100
METRIC RATING
303rd/ 347
METRIC RANK
$109,741
HOUSEHOLDER INCOME AGES 25 - 44 YEARS
100.0/ 100
METRIC RATING
32nd/ 347
METRIC RANK
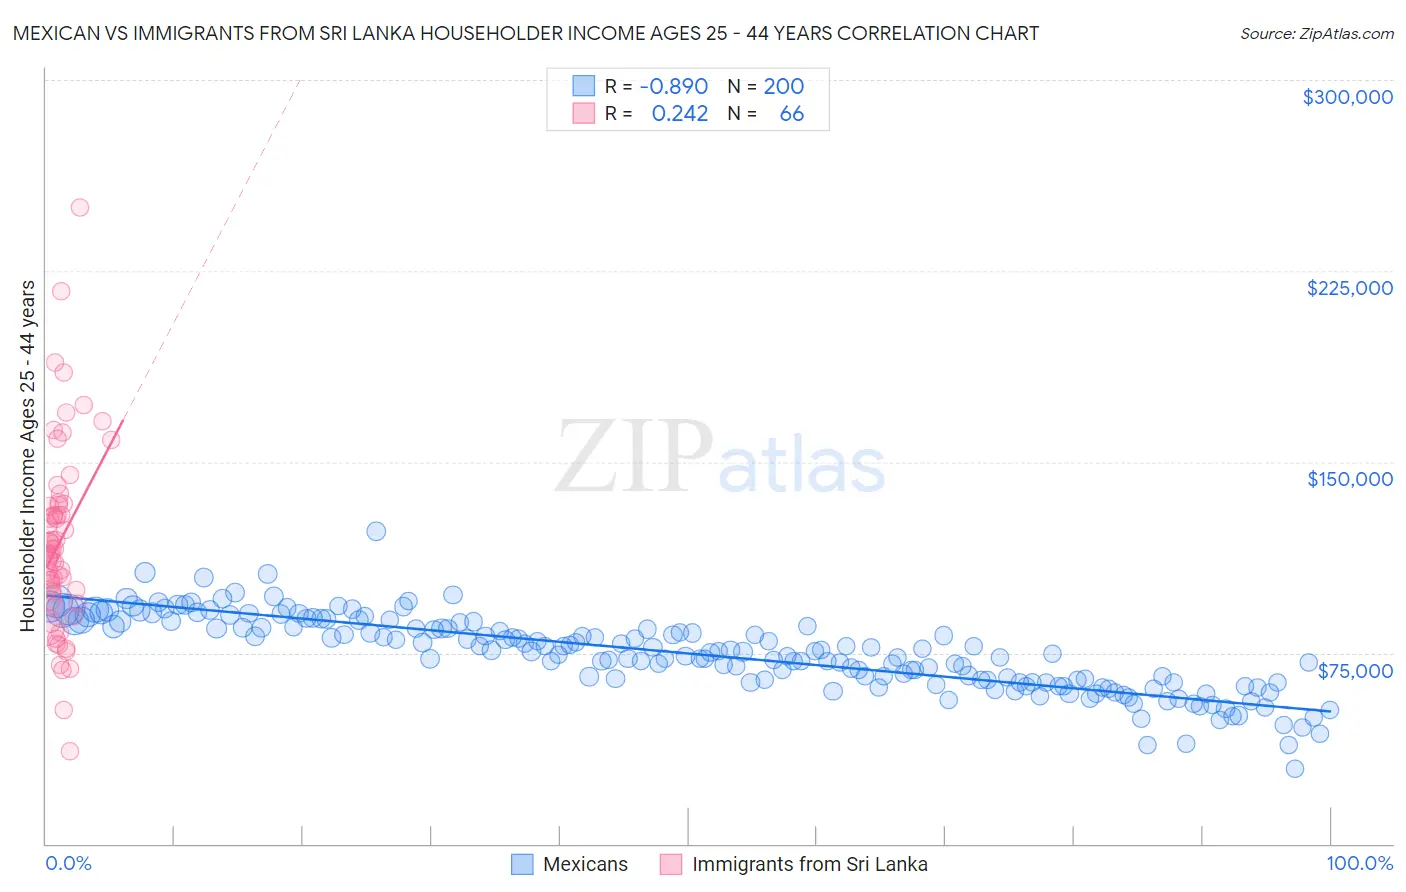
Mexican vs Immigrants from Sri Lanka Householder Income Ages 25 - 44 years Correlation Chart
The statistical analysis conducted on geographies consisting of 559,949,766 people shows a very strong negative correlation between the proportion of Mexicans and household income with householder between the ages 25 and 44 in the United States with a correlation coefficient (R) of -0.890 and weighted average of $80,427. Similarly, the statistical analysis conducted on geographies consisting of 149,615,906 people shows a weak positive correlation between the proportion of Immigrants from Sri Lanka and household income with householder between the ages 25 and 44 in the United States with a correlation coefficient (R) of 0.242 and weighted average of $109,741, a difference of 36.4%.
Householder Income Ages 25 - 44 years Correlation Summary
| Measurement | Mexican | Immigrants from Sri Lanka |
| Minimum | $29,496 | $36,230 |
| Maximum | $122,837 | $250,001 |
| Range | $93,341 | $213,771 |
| Mean | $74,718 | $118,421 |
| Median | $75,510 | $114,758 |
| Interquartile 25% (IQ1) | $63,535 | $97,290 |
| Interquartile 75% (IQ3) | $85,434 | $133,038 |
| Interquartile Range (IQR) | $21,899 | $35,748 |
| Standard Deviation (Sample) | $14,848 | $37,121 |
| Standard Deviation (Population) | $14,811 | $36,839 |
Similar Demographics by Householder Income Ages 25 - 44 years
Demographics Similar to Mexicans by Householder Income Ages 25 - 44 years
In terms of householder income ages 25 - 44 years, the demographic groups most similar to Mexicans are Hispanic or Latino ($80,515, a difference of 0.11%), Immigrants from Caribbean ($80,326, a difference of 0.13%), Immigrants from Dominican Republic ($80,319, a difference of 0.13%), Immigrants from Micronesia ($80,544, a difference of 0.14%), and Apache ($80,260, a difference of 0.21%).
| Demographics | Rating | Rank | Householder Income Ages 25 - 44 years |
| Immigrants | Dominica | 0.1 /100 | #296 | Tragic $81,351 |
| Immigrants | Guatemala | 0.1 /100 | #297 | Tragic $81,341 |
| Dominicans | 0.1 /100 | #298 | Tragic $81,229 |
| Immigrants | Liberia | 0.1 /100 | #299 | Tragic $80,863 |
| Cherokee | 0.0 /100 | #300 | Tragic $80,843 |
| Immigrants | Micronesia | 0.0 /100 | #301 | Tragic $80,544 |
| Hispanics or Latinos | 0.0 /100 | #302 | Tragic $80,515 |
| Mexicans | 0.0 /100 | #303 | Tragic $80,427 |
| Immigrants | Caribbean | 0.0 /100 | #304 | Tragic $80,326 |
| Immigrants | Dominican Republic | 0.0 /100 | #305 | Tragic $80,319 |
| Apache | 0.0 /100 | #306 | Tragic $80,260 |
| Haitians | 0.0 /100 | #307 | Tragic $80,055 |
| Immigrants | Central America | 0.0 /100 | #308 | Tragic $80,012 |
| Chippewa | 0.0 /100 | #309 | Tragic $80,005 |
| Fijians | 0.0 /100 | #310 | Tragic $79,956 |
Demographics Similar to Immigrants from Sri Lanka by Householder Income Ages 25 - 44 years
In terms of householder income ages 25 - 44 years, the demographic groups most similar to Immigrants from Sri Lanka are Bhutanese ($109,520, a difference of 0.20%), Maltese ($110,064, a difference of 0.29%), Immigrants from Greece ($110,103, a difference of 0.33%), Bolivian ($109,372, a difference of 0.34%), and Immigrants from Switzerland ($109,185, a difference of 0.51%).
| Demographics | Rating | Rank | Householder Income Ages 25 - 44 years |
| Immigrants | Northern Europe | 100.0 /100 | #25 | Exceptional $111,676 |
| Immigrants | Asia | 100.0 /100 | #26 | Exceptional $110,787 |
| Russians | 100.0 /100 | #27 | Exceptional $110,398 |
| Immigrants | Denmark | 100.0 /100 | #28 | Exceptional $110,363 |
| Turks | 100.0 /100 | #29 | Exceptional $110,318 |
| Immigrants | Greece | 100.0 /100 | #30 | Exceptional $110,103 |
| Maltese | 100.0 /100 | #31 | Exceptional $110,064 |
| Immigrants | Sri Lanka | 100.0 /100 | #32 | Exceptional $109,741 |
| Bhutanese | 100.0 /100 | #33 | Exceptional $109,520 |
| Bolivians | 100.0 /100 | #34 | Exceptional $109,372 |
| Immigrants | Switzerland | 100.0 /100 | #35 | Exceptional $109,185 |
| Latvians | 100.0 /100 | #36 | Exceptional $108,926 |
| Immigrants | Russia | 100.0 /100 | #37 | Exceptional $108,751 |
| Soviet Union | 100.0 /100 | #38 | Exceptional $108,457 |
| Immigrants | France | 99.9 /100 | #39 | Exceptional $108,257 |