Mexican American Indian vs Immigrants from South Africa Median Earnings
COMPARE
Mexican American Indian
Immigrants from South Africa
Median Earnings
Median Earnings Comparison
Mexican American Indians
Immigrants from South Africa
$41,719
MEDIAN EARNINGS
0.1/ 100
METRIC RATING
286th/ 347
METRIC RANK
$51,850
MEDIAN EARNINGS
100.0/ 100
METRIC RATING
50th/ 347
METRIC RANK
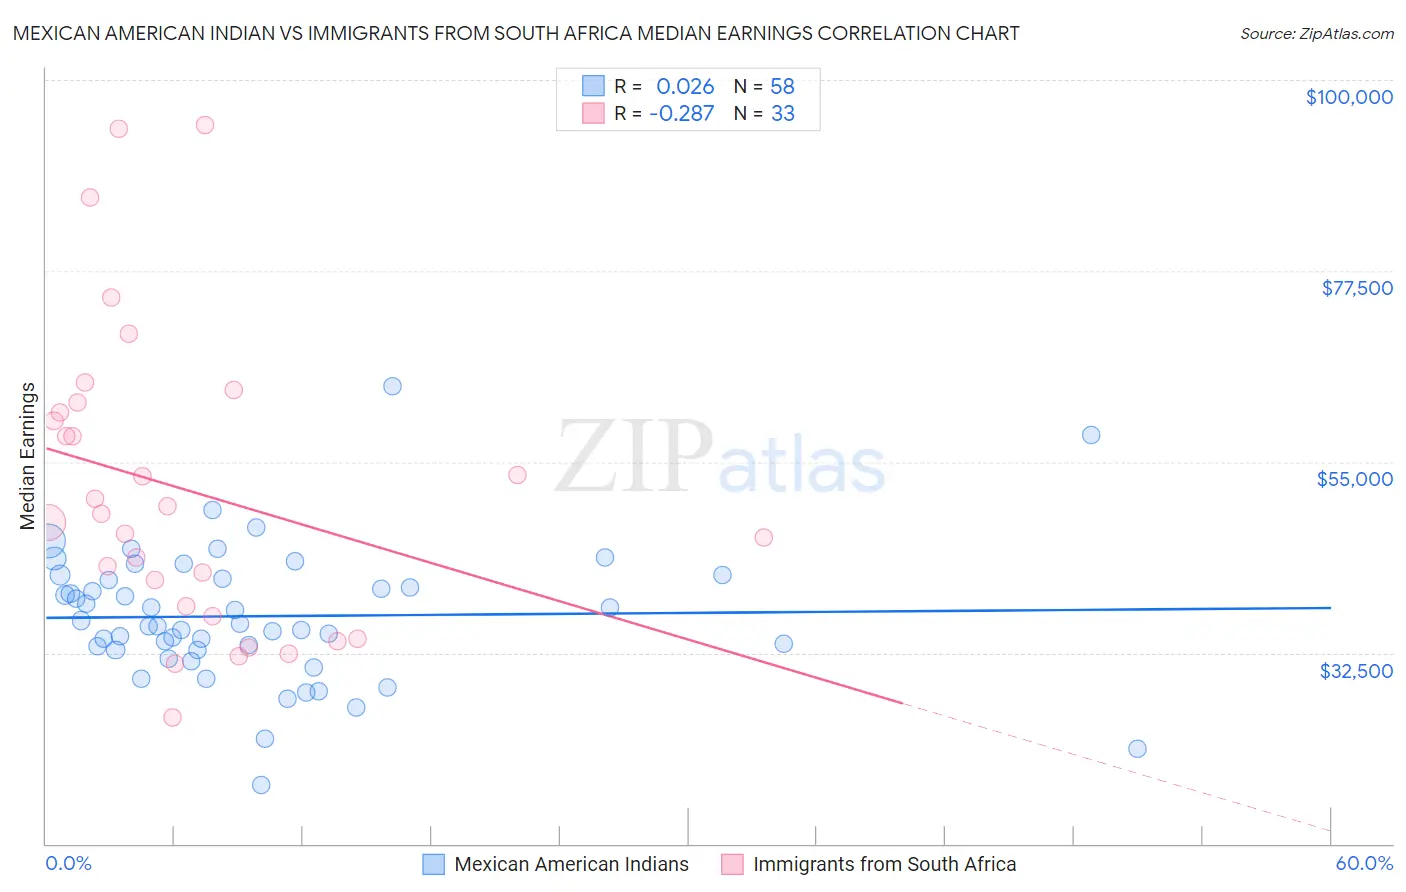
Mexican American Indian vs Immigrants from South Africa Median Earnings Correlation Chart
The statistical analysis conducted on geographies consisting of 317,581,604 people shows no correlation between the proportion of Mexican American Indians and median earnings in the United States with a correlation coefficient (R) of 0.026 and weighted average of $41,719. Similarly, the statistical analysis conducted on geographies consisting of 233,296,995 people shows a weak negative correlation between the proportion of Immigrants from South Africa and median earnings in the United States with a correlation coefficient (R) of -0.287 and weighted average of $51,850, a difference of 24.3%.
Median Earnings Correlation Summary
| Measurement | Mexican American Indian | Immigrants from South Africa |
| Minimum | $16,986 | $24,853 |
| Maximum | $63,917 | $94,663 |
| Range | $46,931 | $69,810 |
| Mean | $36,825 | $51,765 |
| Median | $35,754 | $48,953 |
| Interquartile 25% (IQ1) | $32,817 | $37,328 |
| Interquartile 75% (IQ3) | $41,197 | $61,361 |
| Interquartile Range (IQR) | $8,379 | $24,033 |
| Standard Deviation (Sample) | $7,970 | $17,731 |
| Standard Deviation (Population) | $7,901 | $17,460 |
Similar Demographics by Median Earnings
Demographics Similar to Mexican American Indians by Median Earnings
In terms of median earnings, the demographic groups most similar to Mexican American Indians are Immigrants from Nicaragua ($41,737, a difference of 0.040%), Indonesian ($41,701, a difference of 0.040%), Blackfeet ($41,822, a difference of 0.25%), Dominican ($41,864, a difference of 0.35%), and Immigrants from Dominican Republic ($41,554, a difference of 0.40%).
| Demographics | Rating | Rank | Median Earnings |
| Colville | 0.2 /100 | #279 | Tragic $42,151 |
| Hmong | 0.2 /100 | #280 | Tragic $42,111 |
| Marshallese | 0.2 /100 | #281 | Tragic $41,969 |
| Africans | 0.2 /100 | #282 | Tragic $41,955 |
| Dominicans | 0.2 /100 | #283 | Tragic $41,864 |
| Blackfeet | 0.2 /100 | #284 | Tragic $41,822 |
| Immigrants | Nicaragua | 0.1 /100 | #285 | Tragic $41,737 |
| Mexican American Indians | 0.1 /100 | #286 | Tragic $41,719 |
| Indonesians | 0.1 /100 | #287 | Tragic $41,701 |
| Immigrants | Dominican Republic | 0.1 /100 | #288 | Tragic $41,554 |
| Comanche | 0.1 /100 | #289 | Tragic $41,519 |
| Paiute | 0.1 /100 | #290 | Tragic $41,508 |
| Central American Indians | 0.1 /100 | #291 | Tragic $41,474 |
| U.S. Virgin Islanders | 0.1 /100 | #292 | Tragic $41,448 |
| Immigrants | Zaire | 0.1 /100 | #293 | Tragic $41,325 |
Demographics Similar to Immigrants from South Africa by Median Earnings
In terms of median earnings, the demographic groups most similar to Immigrants from South Africa are Immigrants from Austria ($51,826, a difference of 0.050%), Estonian ($51,772, a difference of 0.15%), Immigrants from Norway ($51,758, a difference of 0.18%), Immigrants from Indonesia ($51,715, a difference of 0.26%), and Egyptian ($51,701, a difference of 0.29%).
| Demographics | Rating | Rank | Median Earnings |
| Immigrants | Malaysia | 100.0 /100 | #43 | Exceptional $52,514 |
| Bulgarians | 100.0 /100 | #44 | Exceptional $52,512 |
| Immigrants | Czechoslovakia | 100.0 /100 | #45 | Exceptional $52,361 |
| Bhutanese | 100.0 /100 | #46 | Exceptional $52,297 |
| Australians | 100.0 /100 | #47 | Exceptional $52,294 |
| Immigrants | Europe | 100.0 /100 | #48 | Exceptional $52,195 |
| Bolivians | 100.0 /100 | #49 | Exceptional $52,005 |
| Immigrants | South Africa | 100.0 /100 | #50 | Exceptional $51,850 |
| Immigrants | Austria | 99.9 /100 | #51 | Exceptional $51,826 |
| Estonians | 99.9 /100 | #52 | Exceptional $51,772 |
| Immigrants | Norway | 99.9 /100 | #53 | Exceptional $51,758 |
| Immigrants | Indonesia | 99.9 /100 | #54 | Exceptional $51,715 |
| Egyptians | 99.9 /100 | #55 | Exceptional $51,701 |
| Immigrants | Pakistan | 99.9 /100 | #56 | Exceptional $51,693 |
| Immigrants | Eastern Europe | 99.9 /100 | #57 | Exceptional $51,624 |