Mexican American Indian vs Immigrants from South Africa Disability Age 65 to 74
COMPARE
Mexican American Indian
Immigrants from South Africa
Disability Age 65 to 74
Disability Age 65 to 74 Comparison
Mexican American Indians
Immigrants from South Africa
26.2%
DISABILITY AGE 65 TO 74
0.0/ 100
METRIC RATING
288th/ 347
METRIC RANK
21.7%
DISABILITY AGE 65 TO 74
99.3/ 100
METRIC RATING
67th/ 347
METRIC RANK
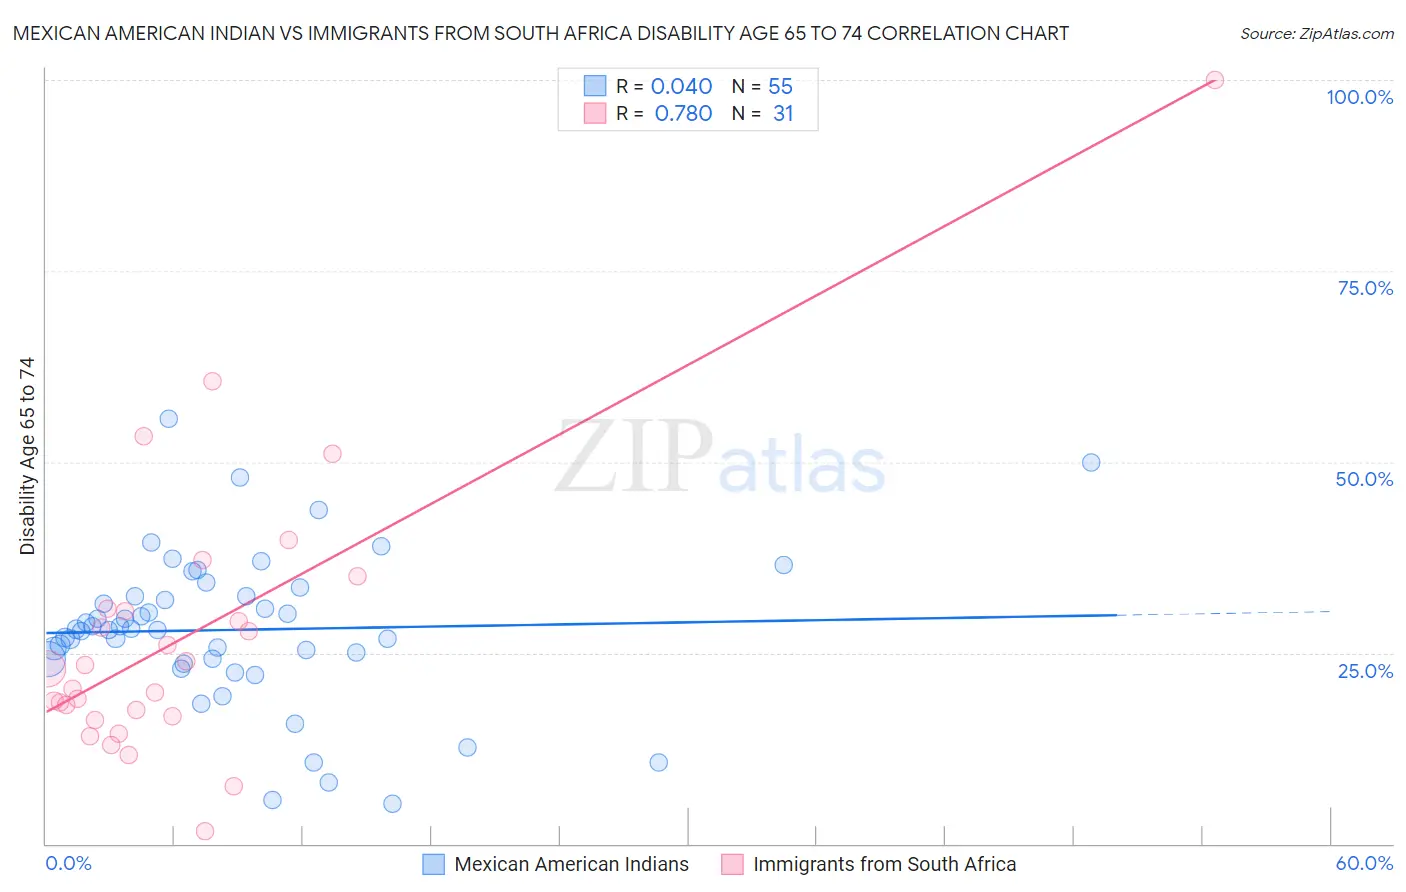
Mexican American Indian vs Immigrants from South Africa Disability Age 65 to 74 Correlation Chart
The statistical analysis conducted on geographies consisting of 317,155,514 people shows no correlation between the proportion of Mexican American Indians and percentage of population with a disability between the ages 65 and 75 in the United States with a correlation coefficient (R) of 0.040 and weighted average of 26.2%. Similarly, the statistical analysis conducted on geographies consisting of 233,082,917 people shows a strong positive correlation between the proportion of Immigrants from South Africa and percentage of population with a disability between the ages 65 and 75 in the United States with a correlation coefficient (R) of 0.780 and weighted average of 21.7%, a difference of 20.8%.
Disability Age 65 to 74 Correlation Summary
| Measurement | Mexican American Indian | Immigrants from South Africa |
| Minimum | 5.2% | 1.7% |
| Maximum | 55.7% | 100.0% |
| Range | 50.5% | 98.3% |
| Mean | 28.0% | 27.3% |
| Median | 28.1% | 23.0% |
| Interquartile 25% (IQ1) | 24.2% | 16.7% |
| Interquartile 75% (IQ3) | 32.5% | 30.8% |
| Interquartile Range (IQR) | 8.3% | 14.2% |
| Standard Deviation (Sample) | 10.0% | 18.8% |
| Standard Deviation (Population) | 9.9% | 18.5% |
Similar Demographics by Disability Age 65 to 74
Demographics Similar to Mexican American Indians by Disability Age 65 to 74
In terms of disability age 65 to 74, the demographic groups most similar to Mexican American Indians are Immigrants from Laos (26.1%, a difference of 0.10%), Immigrants from Micronesia (26.1%, a difference of 0.16%), African (26.2%, a difference of 0.32%), Immigrants from Congo (26.0%, a difference of 0.59%), and Immigrants from the Azores (26.0%, a difference of 0.61%).
| Demographics | Rating | Rank | Disability Age 65 to 74 |
| Immigrants | Honduras | 0.1 /100 | #281 | Tragic 25.9% |
| Delaware | 0.1 /100 | #282 | Tragic 25.9% |
| Spanish Americans | 0.0 /100 | #283 | Tragic 25.9% |
| Immigrants | Azores | 0.0 /100 | #284 | Tragic 26.0% |
| Immigrants | Congo | 0.0 /100 | #285 | Tragic 26.0% |
| Immigrants | Micronesia | 0.0 /100 | #286 | Tragic 26.1% |
| Immigrants | Laos | 0.0 /100 | #287 | Tragic 26.1% |
| Mexican American Indians | 0.0 /100 | #288 | Tragic 26.2% |
| Africans | 0.0 /100 | #289 | Tragic 26.2% |
| Immigrants | Cabo Verde | 0.0 /100 | #290 | Tragic 26.3% |
| Spanish American Indians | 0.0 /100 | #291 | Tragic 26.4% |
| Blackfeet | 0.0 /100 | #292 | Tragic 26.6% |
| Immigrants | Central America | 0.0 /100 | #293 | Tragic 26.6% |
| Dominicans | 0.0 /100 | #294 | Tragic 26.7% |
| Hispanics or Latinos | 0.0 /100 | #295 | Tragic 26.7% |
Demographics Similar to Immigrants from South Africa by Disability Age 65 to 74
In terms of disability age 65 to 74, the demographic groups most similar to Immigrants from South Africa are Immigrants from Scotland (21.7%, a difference of 0.090%), Maltese (21.6%, a difference of 0.20%), Immigrants from Russia (21.6%, a difference of 0.22%), Immigrants from Egypt (21.7%, a difference of 0.22%), and Immigrants from Latvia (21.6%, a difference of 0.23%).
| Demographics | Rating | Rank | Disability Age 65 to 74 |
| Immigrants | North Macedonia | 99.5 /100 | #60 | Exceptional 21.6% |
| Egyptians | 99.5 /100 | #61 | Exceptional 21.6% |
| Carpatho Rusyns | 99.5 /100 | #62 | Exceptional 21.6% |
| Immigrants | Europe | 99.4 /100 | #63 | Exceptional 21.6% |
| Immigrants | Latvia | 99.4 /100 | #64 | Exceptional 21.6% |
| Immigrants | Russia | 99.4 /100 | #65 | Exceptional 21.6% |
| Maltese | 99.4 /100 | #66 | Exceptional 21.6% |
| Immigrants | South Africa | 99.3 /100 | #67 | Exceptional 21.7% |
| Immigrants | Scotland | 99.3 /100 | #68 | Exceptional 21.7% |
| Immigrants | Egypt | 99.2 /100 | #69 | Exceptional 21.7% |
| Chinese | 99.2 /100 | #70 | Exceptional 21.7% |
| Immigrants | Belarus | 99.2 /100 | #71 | Exceptional 21.7% |
| Immigrants | Hungary | 99.2 /100 | #72 | Exceptional 21.7% |
| Immigrants | Venezuela | 99.0 /100 | #73 | Exceptional 21.8% |
| Cambodians | 99.0 /100 | #74 | Exceptional 21.8% |