Mexican American Indian vs Spanish Median Male Earnings
COMPARE
Mexican American Indian
Spanish
Median Male Earnings
Median Male Earnings Comparison
Mexican American Indians
Spanish
$47,990
MEDIAN MALE EARNINGS
0.2/ 100
METRIC RATING
286th/ 347
METRIC RANK
$53,576
MEDIAN MALE EARNINGS
29.0/ 100
METRIC RATING
194th/ 347
METRIC RANK
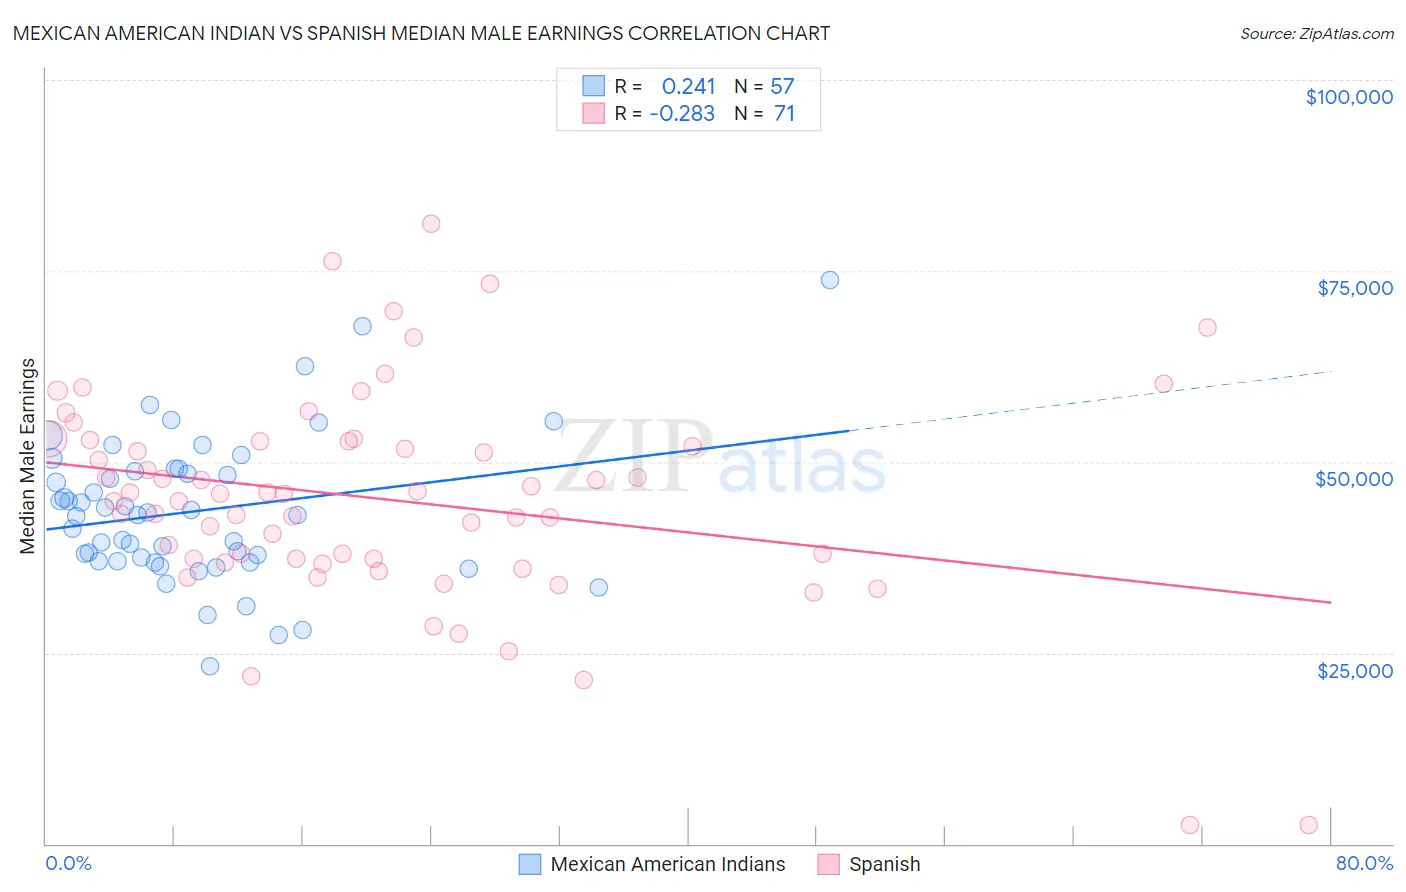
Mexican American Indian vs Spanish Median Male Earnings Correlation Chart
The statistical analysis conducted on geographies consisting of 317,531,084 people shows a weak positive correlation between the proportion of Mexican American Indians and median male earnings in the United States with a correlation coefficient (R) of 0.241 and weighted average of $47,990. Similarly, the statistical analysis conducted on geographies consisting of 421,997,889 people shows a weak negative correlation between the proportion of Spanish and median male earnings in the United States with a correlation coefficient (R) of -0.283 and weighted average of $53,576, a difference of 11.6%.
Median Male Earnings Correlation Summary
| Measurement | Mexican American Indian | Spanish |
| Minimum | $23,167 | $2,499 |
| Maximum | $73,750 | $81,250 |
| Range | $50,583 | $78,751 |
| Mean | $43,547 | $45,106 |
| Median | $43,107 | $45,773 |
| Interquartile 25% (IQ1) | $36,938 | $37,348 |
| Interquartile 75% (IQ3) | $48,895 | $52,702 |
| Interquartile Range (IQR) | $11,957 | $15,354 |
| Standard Deviation (Sample) | $9,541 | $14,070 |
| Standard Deviation (Population) | $9,457 | $13,971 |
Similar Demographics by Median Male Earnings
Demographics Similar to Mexican American Indians by Median Male Earnings
In terms of median male earnings, the demographic groups most similar to Mexican American Indians are Paiute ($47,991, a difference of 0.0%), African ($47,994, a difference of 0.010%), Immigrants from El Salvador ($47,973, a difference of 0.040%), Immigrants from Jamaica ($48,040, a difference of 0.10%), and Shoshone ($47,930, a difference of 0.12%).
| Demographics | Rating | Rank | Median Male Earnings |
| Hmong | 0.2 /100 | #279 | Tragic $48,254 |
| Comanche | 0.2 /100 | #280 | Tragic $48,202 |
| Marshallese | 0.2 /100 | #281 | Tragic $48,137 |
| Central Americans | 0.2 /100 | #282 | Tragic $48,093 |
| Immigrants | Jamaica | 0.2 /100 | #283 | Tragic $48,040 |
| Africans | 0.2 /100 | #284 | Tragic $47,994 |
| Paiute | 0.2 /100 | #285 | Tragic $47,991 |
| Mexican American Indians | 0.2 /100 | #286 | Tragic $47,990 |
| Immigrants | El Salvador | 0.2 /100 | #287 | Tragic $47,973 |
| Shoshone | 0.2 /100 | #288 | Tragic $47,930 |
| Chickasaw | 0.1 /100 | #289 | Tragic $47,832 |
| Immigrants | Belize | 0.1 /100 | #290 | Tragic $47,809 |
| Choctaw | 0.1 /100 | #291 | Tragic $47,729 |
| Immigrants | Dominica | 0.1 /100 | #292 | Tragic $47,651 |
| Indonesians | 0.1 /100 | #293 | Tragic $47,503 |
Demographics Similar to Spanish by Median Male Earnings
In terms of median male earnings, the demographic groups most similar to Spanish are Kenyan ($53,647, a difference of 0.13%), Immigrants from the Azores ($53,503, a difference of 0.14%), Scotch-Irish ($53,658, a difference of 0.15%), Guamanian/Chamorro ($53,661, a difference of 0.16%), and Uruguayan ($53,680, a difference of 0.19%).
| Demographics | Rating | Rank | Median Male Earnings |
| Immigrants | Eritrea | 31.8 /100 | #187 | Fair $53,715 |
| Immigrants | Eastern Africa | 31.8 /100 | #188 | Fair $53,713 |
| Puget Sound Salish | 31.6 /100 | #189 | Fair $53,704 |
| Uruguayans | 31.1 /100 | #190 | Fair $53,680 |
| Guamanians/Chamorros | 30.7 /100 | #191 | Fair $53,661 |
| Scotch-Irish | 30.6 /100 | #192 | Fair $53,658 |
| Kenyans | 30.4 /100 | #193 | Fair $53,647 |
| Spanish | 29.0 /100 | #194 | Fair $53,576 |
| Immigrants | Azores | 27.5 /100 | #195 | Fair $53,503 |
| Immigrants | Africa | 26.6 /100 | #196 | Fair $53,457 |
| Immigrants | Kenya | 26.0 /100 | #197 | Fair $53,427 |
| Immigrants | Costa Rica | 22.6 /100 | #198 | Fair $53,237 |
| Tongans | 22.3 /100 | #199 | Fair $53,218 |
| Immigrants | Thailand | 17.5 /100 | #200 | Poor $52,908 |
| Immigrants | Bosnia and Herzegovina | 16.9 /100 | #201 | Poor $52,869 |