Mexican American Indian vs Jordanian Median Family Income
COMPARE
Mexican American Indian
Jordanian
Median Family Income
Median Family Income Comparison
Mexican American Indians
Jordanians
$90,918
MEDIAN FAMILY INCOME
0.2/ 100
METRIC RATING
267th/ 347
METRIC RANK
$109,865
MEDIAN FAMILY INCOME
97.5/ 100
METRIC RATING
97th/ 347
METRIC RANK
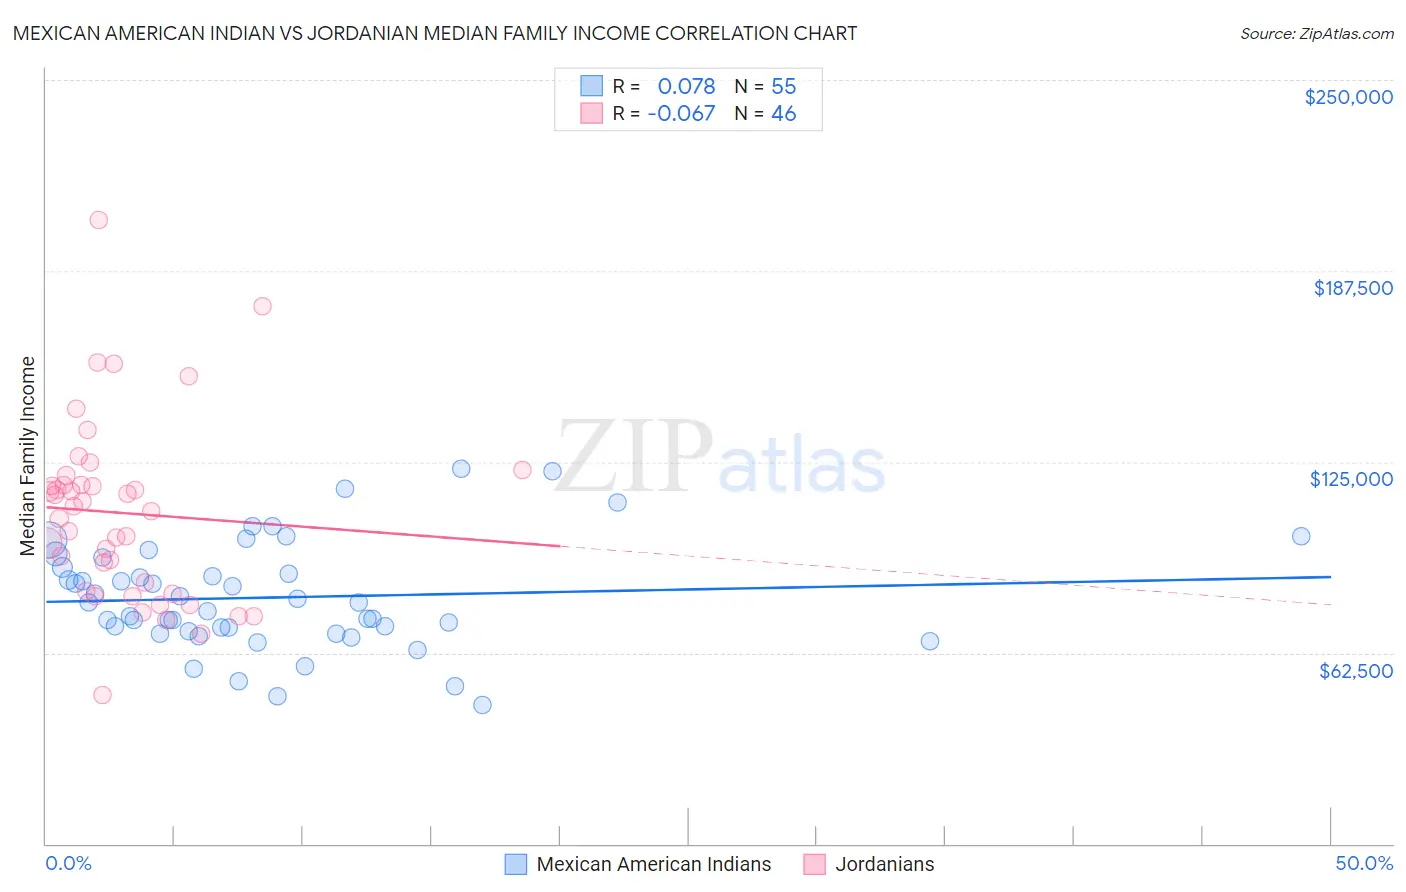
Mexican American Indian vs Jordanian Median Family Income Correlation Chart
The statistical analysis conducted on geographies consisting of 317,461,685 people shows a slight positive correlation between the proportion of Mexican American Indians and median family income in the United States with a correlation coefficient (R) of 0.078 and weighted average of $90,918. Similarly, the statistical analysis conducted on geographies consisting of 166,350,373 people shows a slight negative correlation between the proportion of Jordanians and median family income in the United States with a correlation coefficient (R) of -0.067 and weighted average of $109,865, a difference of 20.8%.
Median Family Income Correlation Summary
| Measurement | Mexican American Indian | Jordanian |
| Minimum | $45,568 | $48,661 |
| Maximum | $122,917 | $204,272 |
| Range | $77,349 | $155,611 |
| Mean | $80,601 | $108,250 |
| Median | $78,819 | $109,650 |
| Interquartile 25% (IQ1) | $69,567 | $82,841 |
| Interquartile 75% (IQ3) | $90,530 | $117,365 |
| Interquartile Range (IQR) | $20,964 | $34,524 |
| Standard Deviation (Sample) | $17,524 | $29,858 |
| Standard Deviation (Population) | $17,364 | $29,532 |
Similar Demographics by Median Family Income
Demographics Similar to Mexican American Indians by Median Family Income
In terms of median family income, the demographic groups most similar to Mexican American Indians are Cree ($90,882, a difference of 0.040%), Belizean ($90,880, a difference of 0.040%), Central American ($91,087, a difference of 0.19%), Jamaican ($90,581, a difference of 0.37%), and Iroquois ($90,543, a difference of 0.41%).
| Demographics | Rating | Rank | Median Family Income |
| Pennsylvania Germans | 0.4 /100 | #260 | Tragic $91,763 |
| Inupiat | 0.4 /100 | #261 | Tragic $91,730 |
| Liberians | 0.4 /100 | #262 | Tragic $91,722 |
| Immigrants | West Indies | 0.3 /100 | #263 | Tragic $91,588 |
| Senegalese | 0.3 /100 | #264 | Tragic $91,475 |
| Hmong | 0.3 /100 | #265 | Tragic $91,296 |
| Central Americans | 0.3 /100 | #266 | Tragic $91,087 |
| Mexican American Indians | 0.2 /100 | #267 | Tragic $90,918 |
| Cree | 0.2 /100 | #268 | Tragic $90,882 |
| Belizeans | 0.2 /100 | #269 | Tragic $90,880 |
| Jamaicans | 0.2 /100 | #270 | Tragic $90,581 |
| Iroquois | 0.2 /100 | #271 | Tragic $90,543 |
| Immigrants | Liberia | 0.2 /100 | #272 | Tragic $90,450 |
| Immigrants | Micronesia | 0.2 /100 | #273 | Tragic $90,345 |
| Spanish Americans | 0.2 /100 | #274 | Tragic $90,322 |
Demographics Similar to Jordanians by Median Family Income
In terms of median family income, the demographic groups most similar to Jordanians are Immigrants from Moldova ($109,975, a difference of 0.10%), Immigrants from Kuwait ($109,731, a difference of 0.12%), Zimbabwean ($110,011, a difference of 0.13%), Armenian ($109,692, a difference of 0.16%), and Macedonian ($109,668, a difference of 0.18%).
| Demographics | Rating | Rank | Median Family Income |
| Northern Europeans | 98.3 /100 | #90 | Exceptional $110,635 |
| Immigrants | Southern Europe | 98.3 /100 | #91 | Exceptional $110,614 |
| Immigrants | Lebanon | 97.9 /100 | #92 | Exceptional $110,159 |
| Immigrants | Kazakhstan | 97.8 /100 | #93 | Exceptional $110,137 |
| Koreans | 97.8 /100 | #94 | Exceptional $110,103 |
| Zimbabweans | 97.7 /100 | #95 | Exceptional $110,011 |
| Immigrants | Moldova | 97.7 /100 | #96 | Exceptional $109,975 |
| Jordanians | 97.5 /100 | #97 | Exceptional $109,865 |
| Immigrants | Kuwait | 97.4 /100 | #98 | Exceptional $109,731 |
| Armenians | 97.3 /100 | #99 | Exceptional $109,692 |
| Macedonians | 97.3 /100 | #100 | Exceptional $109,668 |
| Immigrants | Ukraine | 97.2 /100 | #101 | Exceptional $109,645 |
| Assyrians/Chaldeans/Syriacs | 97.2 /100 | #102 | Exceptional $109,622 |
| Immigrants | Brazil | 96.9 /100 | #103 | Exceptional $109,418 |
| Palestinians | 96.9 /100 | #104 | Exceptional $109,413 |