Taiwanese vs Celtic Householder Income Ages 25 - 44 years
COMPARE
Taiwanese
Celtic
Householder Income Ages 25 - 44 years
Householder Income Ages 25 - 44 years Comparison
Taiwanese
Celtics
$101,492
HOUSEHOLDER INCOME AGES 25 - 44 YEARS
97.9/ 100
METRIC RATING
99th/ 347
METRIC RANK
$92,241
HOUSEHOLDER INCOME AGES 25 - 44 YEARS
21.6/ 100
METRIC RATING
195th/ 347
METRIC RANK
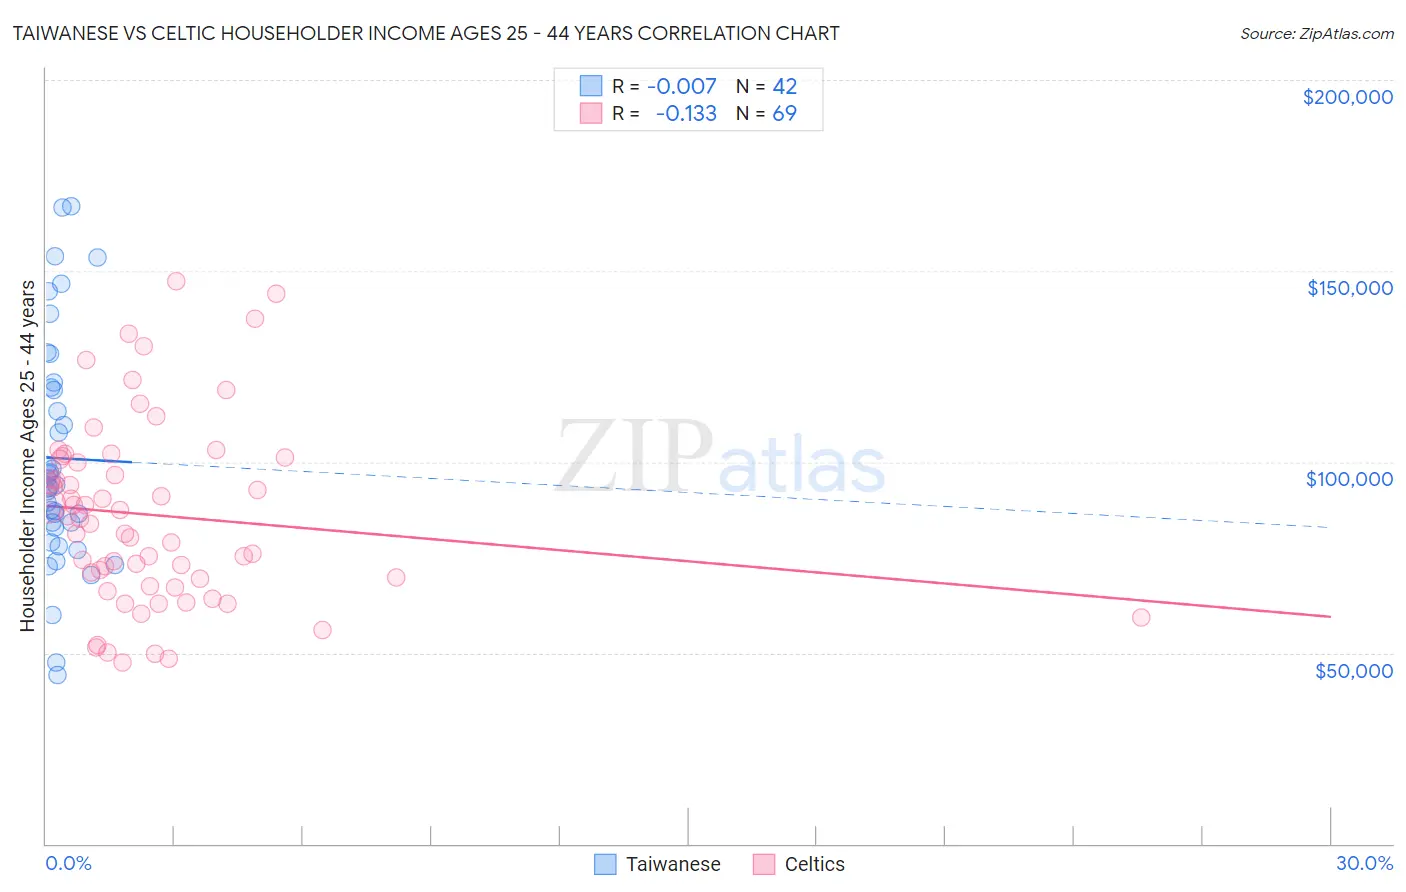
Taiwanese vs Celtic Householder Income Ages 25 - 44 years Correlation Chart
The statistical analysis conducted on geographies consisting of 31,707,824 people shows no correlation between the proportion of Taiwanese and household income with householder between the ages 25 and 44 in the United States with a correlation coefficient (R) of -0.007 and weighted average of $101,492. Similarly, the statistical analysis conducted on geographies consisting of 168,638,576 people shows a poor negative correlation between the proportion of Celtics and household income with householder between the ages 25 and 44 in the United States with a correlation coefficient (R) of -0.133 and weighted average of $92,241, a difference of 10.0%.
Householder Income Ages 25 - 44 years Correlation Summary
| Measurement | Taiwanese | Celtic |
| Minimum | $44,050 | $47,456 |
| Maximum | $166,985 | $147,258 |
| Range | $122,935 | $99,801 |
| Mean | $100,976 | $86,089 |
| Median | $93,672 | $84,960 |
| Interquartile 25% (IQ1) | $82,680 | $68,316 |
| Interquartile 75% (IQ3) | $119,346 | $100,916 |
| Interquartile Range (IQR) | $36,667 | $32,600 |
| Standard Deviation (Sample) | $30,133 | $23,857 |
| Standard Deviation (Population) | $29,772 | $23,683 |
Similar Demographics by Householder Income Ages 25 - 44 years
Demographics Similar to Taiwanese by Householder Income Ages 25 - 44 years
In terms of householder income ages 25 - 44 years, the demographic groups most similar to Taiwanese are Immigrants from Argentina ($101,415, a difference of 0.080%), Albanian ($101,367, a difference of 0.12%), Immigrants from Kazakhstan ($101,727, a difference of 0.23%), Austrian ($101,842, a difference of 0.35%), and Immigrants from Lebanon ($101,124, a difference of 0.36%).
| Demographics | Rating | Rank | Householder Income Ages 25 - 44 years |
| Immigrants | North America | 98.7 /100 | #92 | Exceptional $102,407 |
| Immigrants | England | 98.4 /100 | #93 | Exceptional $102,020 |
| Sri Lankans | 98.4 /100 | #94 | Exceptional $101,960 |
| Assyrians/Chaldeans/Syriacs | 98.3 /100 | #95 | Exceptional $101,936 |
| Macedonians | 98.3 /100 | #96 | Exceptional $101,882 |
| Austrians | 98.3 /100 | #97 | Exceptional $101,842 |
| Immigrants | Kazakhstan | 98.1 /100 | #98 | Exceptional $101,727 |
| Taiwanese | 97.9 /100 | #99 | Exceptional $101,492 |
| Immigrants | Argentina | 97.8 /100 | #100 | Exceptional $101,415 |
| Albanians | 97.8 /100 | #101 | Exceptional $101,367 |
| Immigrants | Lebanon | 97.4 /100 | #102 | Exceptional $101,124 |
| Immigrants | Moldova | 97.4 /100 | #103 | Exceptional $101,091 |
| Immigrants | Poland | 97.4 /100 | #104 | Exceptional $101,065 |
| Immigrants | Vietnam | 96.5 /100 | #105 | Exceptional $100,535 |
| Immigrants | Brazil | 96.5 /100 | #106 | Exceptional $100,534 |
Demographics Similar to Celtics by Householder Income Ages 25 - 44 years
In terms of householder income ages 25 - 44 years, the demographic groups most similar to Celtics are Immigrants from Colombia ($92,204, a difference of 0.040%), Spanish ($92,200, a difference of 0.040%), Immigrants from the Azores ($92,322, a difference of 0.090%), Samoan ($92,385, a difference of 0.16%), and Vietnamese ($92,089, a difference of 0.16%).
| Demographics | Rating | Rank | Householder Income Ages 25 - 44 years |
| Immigrants | Sierra Leone | 30.9 /100 | #188 | Fair $93,115 |
| Dutch | 30.5 /100 | #189 | Fair $93,081 |
| Welsh | 30.0 /100 | #190 | Fair $93,039 |
| Tlingit-Haida | 29.4 /100 | #191 | Fair $92,987 |
| Immigrants | Costa Rica | 28.2 /100 | #192 | Fair $92,876 |
| Samoans | 23.0 /100 | #193 | Fair $92,385 |
| Immigrants | Azores | 22.4 /100 | #194 | Fair $92,322 |
| Celtics | 21.6 /100 | #195 | Fair $92,241 |
| Immigrants | Colombia | 21.3 /100 | #196 | Fair $92,204 |
| Spanish | 21.2 /100 | #197 | Fair $92,200 |
| Vietnamese | 20.2 /100 | #198 | Fair $92,089 |
| Kenyans | 16.8 /100 | #199 | Poor $91,684 |
| Whites/Caucasians | 16.7 /100 | #200 | Poor $91,668 |
| Japanese | 16.4 /100 | #201 | Poor $91,624 |
| Ecuadorians | 16.0 /100 | #202 | Poor $91,574 |