Immigrants from Ukraine vs Alaska Native Householder Income Ages 25 - 44 years
COMPARE
Immigrants from Ukraine
Alaska Native
Householder Income Ages 25 - 44 years
Householder Income Ages 25 - 44 years Comparison
Immigrants from Ukraine
Alaska Natives
$102,664
HOUSEHOLDER INCOME AGES 25 - 44 YEARS
98.9/ 100
METRIC RATING
85th/ 347
METRIC RANK
$88,018
HOUSEHOLDER INCOME AGES 25 - 44 YEARS
2.6/ 100
METRIC RATING
238th/ 347
METRIC RANK
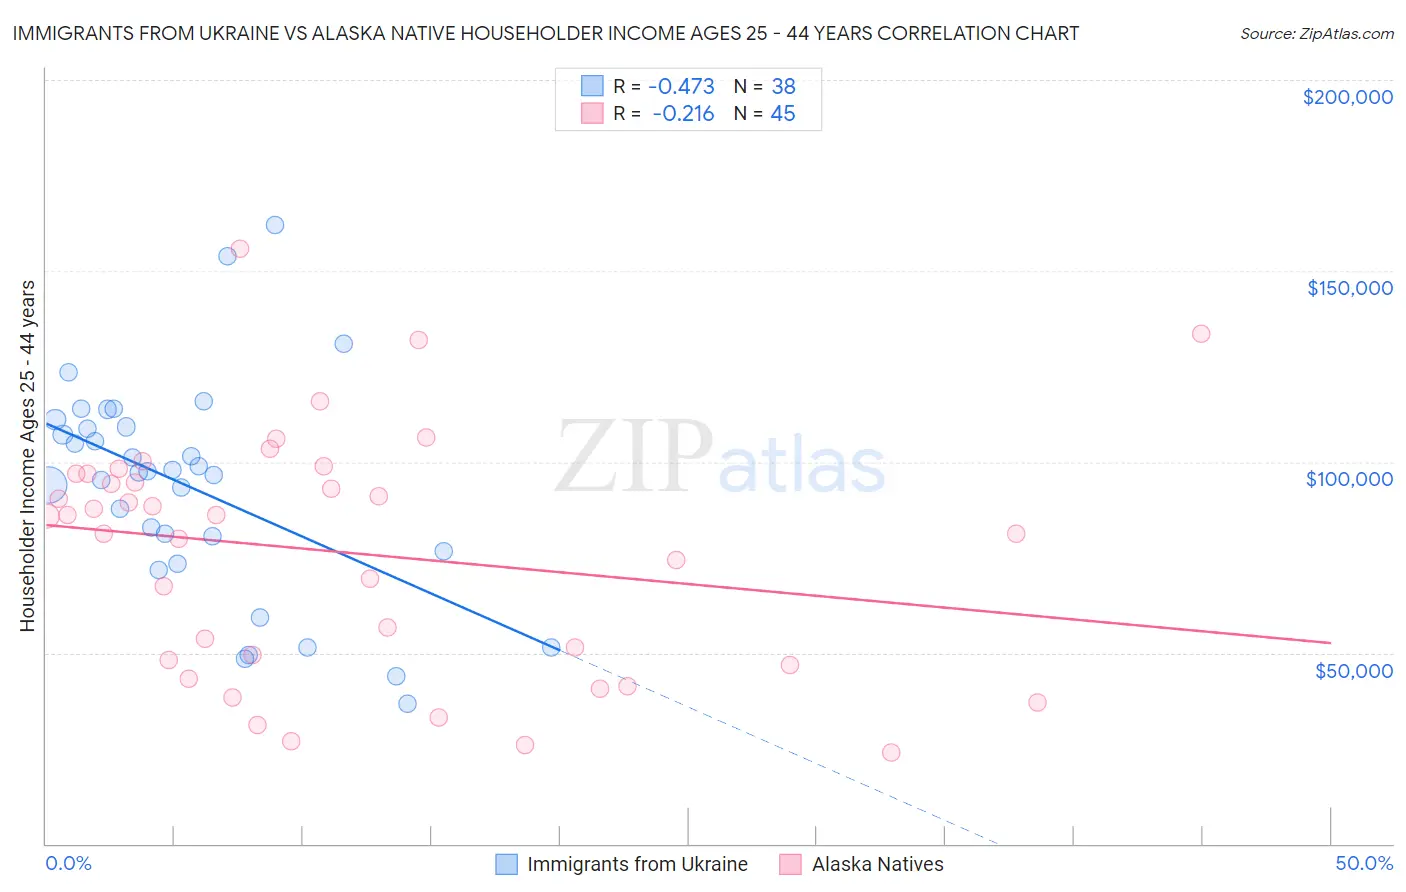
Immigrants from Ukraine vs Alaska Native Householder Income Ages 25 - 44 years Correlation Chart
The statistical analysis conducted on geographies consisting of 289,246,712 people shows a moderate negative correlation between the proportion of Immigrants from Ukraine and household income with householder between the ages 25 and 44 in the United States with a correlation coefficient (R) of -0.473 and weighted average of $102,664. Similarly, the statistical analysis conducted on geographies consisting of 76,687,896 people shows a weak negative correlation between the proportion of Alaska Natives and household income with householder between the ages 25 and 44 in the United States with a correlation coefficient (R) of -0.216 and weighted average of $88,018, a difference of 16.6%.
Householder Income Ages 25 - 44 years Correlation Summary
| Measurement | Immigrants from Ukraine | Alaska Native |
| Minimum | $36,667 | $23,750 |
| Maximum | $161,875 | $155,658 |
| Range | $125,208 | $131,908 |
| Mean | $93,208 | $76,232 |
| Median | $97,296 | $85,753 |
| Interquartile 25% (IQ1) | $76,718 | $47,396 |
| Interquartile 75% (IQ3) | $109,168 | $96,980 |
| Interquartile Range (IQR) | $32,451 | $49,584 |
| Standard Deviation (Sample) | $28,398 | $31,478 |
| Standard Deviation (Population) | $28,022 | $31,126 |
Similar Demographics by Householder Income Ages 25 - 44 years
Demographics Similar to Immigrants from Ukraine by Householder Income Ages 25 - 44 years
In terms of householder income ages 25 - 44 years, the demographic groups most similar to Immigrants from Ukraine are Immigrants from Hungary ($102,655, a difference of 0.010%), Immigrants from Western Europe ($102,654, a difference of 0.010%), Immigrants from Canada ($102,616, a difference of 0.050%), Romanian ($102,544, a difference of 0.12%), and Ukrainian ($102,451, a difference of 0.21%).
| Demographics | Rating | Rank | Householder Income Ages 25 - 44 years |
| Immigrants | Bulgaria | 99.3 /100 | #78 | Exceptional $103,423 |
| Armenians | 99.2 /100 | #79 | Exceptional $103,248 |
| Immigrants | Egypt | 99.2 /100 | #80 | Exceptional $103,192 |
| South Africans | 99.2 /100 | #81 | Exceptional $103,160 |
| Immigrants | Serbia | 99.2 /100 | #82 | Exceptional $103,155 |
| Argentineans | 99.1 /100 | #83 | Exceptional $103,111 |
| Immigrants | Philippines | 99.0 /100 | #84 | Exceptional $102,910 |
| Immigrants | Ukraine | 98.9 /100 | #85 | Exceptional $102,664 |
| Immigrants | Hungary | 98.9 /100 | #86 | Exceptional $102,655 |
| Immigrants | Western Europe | 98.9 /100 | #87 | Exceptional $102,654 |
| Immigrants | Canada | 98.9 /100 | #88 | Exceptional $102,616 |
| Romanians | 98.8 /100 | #89 | Exceptional $102,544 |
| Ukrainians | 98.8 /100 | #90 | Exceptional $102,451 |
| Croatians | 98.7 /100 | #91 | Exceptional $102,414 |
| Immigrants | North America | 98.7 /100 | #92 | Exceptional $102,407 |
Demographics Similar to Alaska Natives by Householder Income Ages 25 - 44 years
In terms of householder income ages 25 - 44 years, the demographic groups most similar to Alaska Natives are Salvadoran ($88,198, a difference of 0.20%), Immigrants from Cameroon ($88,214, a difference of 0.22%), Venezuelan ($88,232, a difference of 0.24%), Bermudan ($88,231, a difference of 0.24%), and Immigrants from Ghana ($87,760, a difference of 0.29%).
| Demographics | Rating | Rank | Householder Income Ages 25 - 44 years |
| Immigrants | Grenada | 3.0 /100 | #231 | Tragic $88,311 |
| Immigrants | Nonimmigrants | 3.0 /100 | #232 | Tragic $88,301 |
| Malaysians | 3.0 /100 | #233 | Tragic $88,291 |
| Venezuelans | 2.9 /100 | #234 | Tragic $88,232 |
| Bermudans | 2.9 /100 | #235 | Tragic $88,231 |
| Immigrants | Cameroon | 2.9 /100 | #236 | Tragic $88,214 |
| Salvadorans | 2.8 /100 | #237 | Tragic $88,198 |
| Alaska Natives | 2.6 /100 | #238 | Tragic $88,018 |
| Immigrants | Ghana | 2.2 /100 | #239 | Tragic $87,760 |
| Nicaraguans | 2.2 /100 | #240 | Tragic $87,751 |
| Nigerians | 2.2 /100 | #241 | Tragic $87,730 |
| West Indians | 1.7 /100 | #242 | Tragic $87,205 |
| Immigrants | West Indies | 1.5 /100 | #243 | Tragic $87,063 |
| Immigrants | Venezuela | 1.5 /100 | #244 | Tragic $87,038 |
| Immigrants | El Salvador | 1.4 /100 | #245 | Tragic $86,913 |