Choctaw vs Alaska Native Householder Income Ages 25 - 44 years
COMPARE
Choctaw
Alaska Native
Householder Income Ages 25 - 44 years
Householder Income Ages 25 - 44 years Comparison
Choctaw
Alaska Natives
$78,168
HOUSEHOLDER INCOME AGES 25 - 44 YEARS
0.0/ 100
METRIC RATING
320th/ 347
METRIC RANK
$88,018
HOUSEHOLDER INCOME AGES 25 - 44 YEARS
2.6/ 100
METRIC RATING
238th/ 347
METRIC RANK
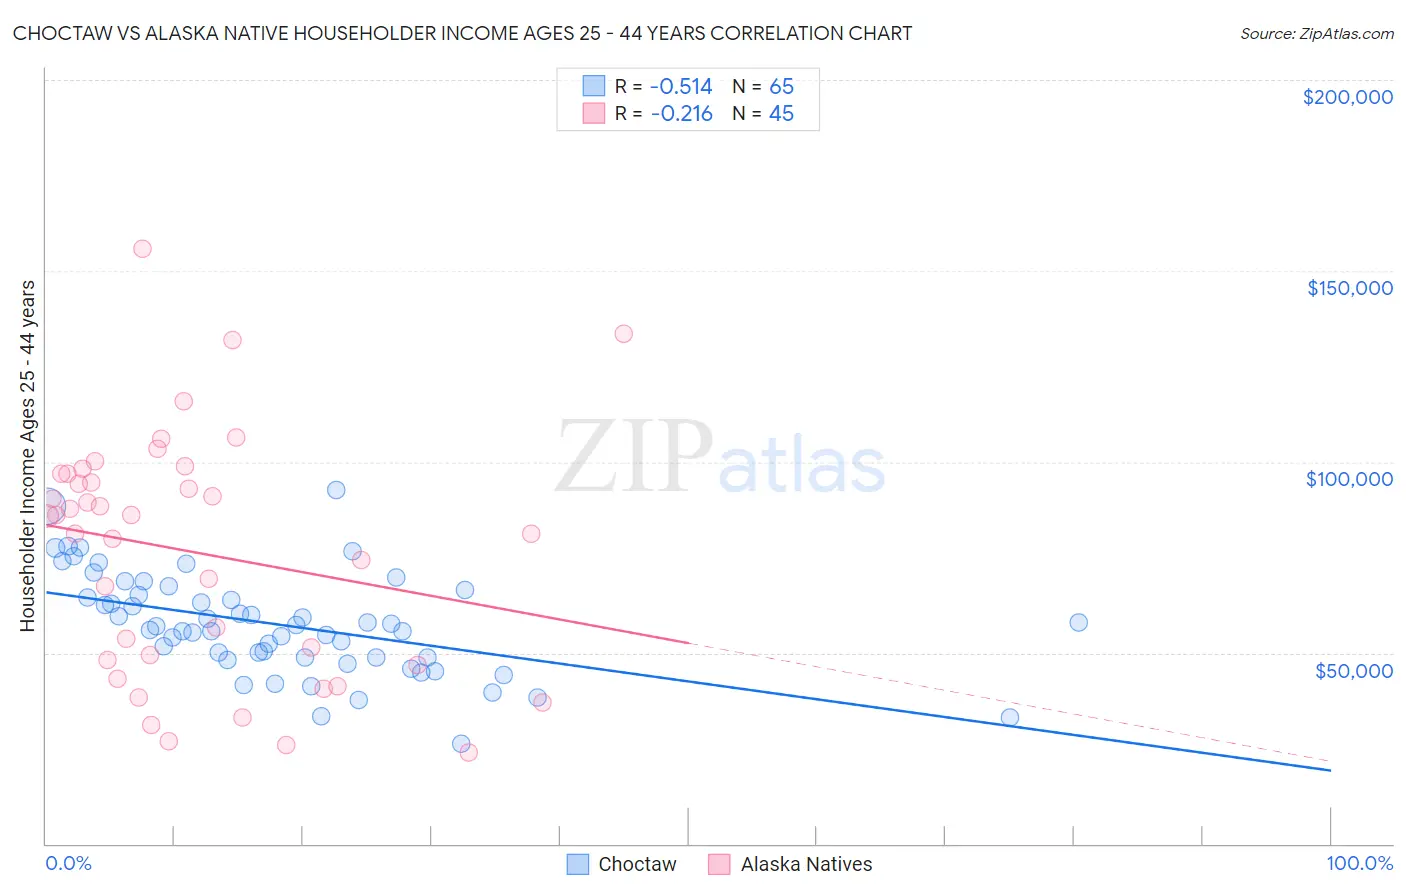
Choctaw vs Alaska Native Householder Income Ages 25 - 44 years Correlation Chart
The statistical analysis conducted on geographies consisting of 269,000,515 people shows a substantial negative correlation between the proportion of Choctaw and household income with householder between the ages 25 and 44 in the United States with a correlation coefficient (R) of -0.514 and weighted average of $78,168. Similarly, the statistical analysis conducted on geographies consisting of 76,687,896 people shows a weak negative correlation between the proportion of Alaska Natives and household income with householder between the ages 25 and 44 in the United States with a correlation coefficient (R) of -0.216 and weighted average of $88,018, a difference of 12.6%.
Householder Income Ages 25 - 44 years Correlation Summary
| Measurement | Choctaw | Alaska Native |
| Minimum | $26,250 | $23,750 |
| Maximum | $92,500 | $155,658 |
| Range | $66,250 | $131,908 |
| Mean | $57,418 | $76,232 |
| Median | $56,972 | $85,753 |
| Interquartile 25% (IQ1) | $48,750 | $47,396 |
| Interquartile 75% (IQ3) | $65,678 | $96,980 |
| Interquartile Range (IQR) | $16,928 | $49,584 |
| Standard Deviation (Sample) | $13,252 | $31,478 |
| Standard Deviation (Population) | $13,150 | $31,126 |
Similar Demographics by Householder Income Ages 25 - 44 years
Demographics Similar to Choctaw by Householder Income Ages 25 - 44 years
In terms of householder income ages 25 - 44 years, the demographic groups most similar to Choctaw are Immigrants from Zaire ($78,045, a difference of 0.16%), Chickasaw ($77,929, a difference of 0.31%), Honduran ($78,540, a difference of 0.48%), Immigrants from Mexico ($78,809, a difference of 0.82%), and U.S. Virgin Islander ($78,911, a difference of 0.95%).
| Demographics | Rating | Rank | Householder Income Ages 25 - 44 years |
| Menominee | 0.0 /100 | #313 | Tragic $79,358 |
| Cheyenne | 0.0 /100 | #314 | Tragic $79,152 |
| Ottawa | 0.0 /100 | #315 | Tragic $79,012 |
| Africans | 0.0 /100 | #316 | Tragic $78,986 |
| U.S. Virgin Islanders | 0.0 /100 | #317 | Tragic $78,911 |
| Immigrants | Mexico | 0.0 /100 | #318 | Tragic $78,809 |
| Hondurans | 0.0 /100 | #319 | Tragic $78,540 |
| Choctaw | 0.0 /100 | #320 | Tragic $78,168 |
| Immigrants | Zaire | 0.0 /100 | #321 | Tragic $78,045 |
| Chickasaw | 0.0 /100 | #322 | Tragic $77,929 |
| Immigrants | Honduras | 0.0 /100 | #323 | Tragic $77,328 |
| Dutch West Indians | 0.0 /100 | #324 | Tragic $77,260 |
| Sioux | 0.0 /100 | #325 | Tragic $77,089 |
| Houma | 0.0 /100 | #326 | Tragic $77,044 |
| Immigrants | Bahamas | 0.0 /100 | #327 | Tragic $76,910 |
Demographics Similar to Alaska Natives by Householder Income Ages 25 - 44 years
In terms of householder income ages 25 - 44 years, the demographic groups most similar to Alaska Natives are Salvadoran ($88,198, a difference of 0.20%), Immigrants from Cameroon ($88,214, a difference of 0.22%), Venezuelan ($88,232, a difference of 0.24%), Bermudan ($88,231, a difference of 0.24%), and Immigrants from Ghana ($87,760, a difference of 0.29%).
| Demographics | Rating | Rank | Householder Income Ages 25 - 44 years |
| Immigrants | Grenada | 3.0 /100 | #231 | Tragic $88,311 |
| Immigrants | Nonimmigrants | 3.0 /100 | #232 | Tragic $88,301 |
| Malaysians | 3.0 /100 | #233 | Tragic $88,291 |
| Venezuelans | 2.9 /100 | #234 | Tragic $88,232 |
| Bermudans | 2.9 /100 | #235 | Tragic $88,231 |
| Immigrants | Cameroon | 2.9 /100 | #236 | Tragic $88,214 |
| Salvadorans | 2.8 /100 | #237 | Tragic $88,198 |
| Alaska Natives | 2.6 /100 | #238 | Tragic $88,018 |
| Immigrants | Ghana | 2.2 /100 | #239 | Tragic $87,760 |
| Nicaraguans | 2.2 /100 | #240 | Tragic $87,751 |
| Nigerians | 2.2 /100 | #241 | Tragic $87,730 |
| West Indians | 1.7 /100 | #242 | Tragic $87,205 |
| Immigrants | West Indies | 1.5 /100 | #243 | Tragic $87,063 |
| Immigrants | Venezuela | 1.5 /100 | #244 | Tragic $87,038 |
| Immigrants | El Salvador | 1.4 /100 | #245 | Tragic $86,913 |