Immigrants from Sri Lanka vs Estonian Median Earnings
COMPARE
Immigrants from Sri Lanka
Estonian
Median Earnings
Median Earnings Comparison
Immigrants from Sri Lanka
Estonians
$53,268
MEDIAN EARNINGS
100.0/ 100
METRIC RATING
34th/ 347
METRIC RANK
$51,772
MEDIAN EARNINGS
99.9/ 100
METRIC RATING
52nd/ 347
METRIC RANK
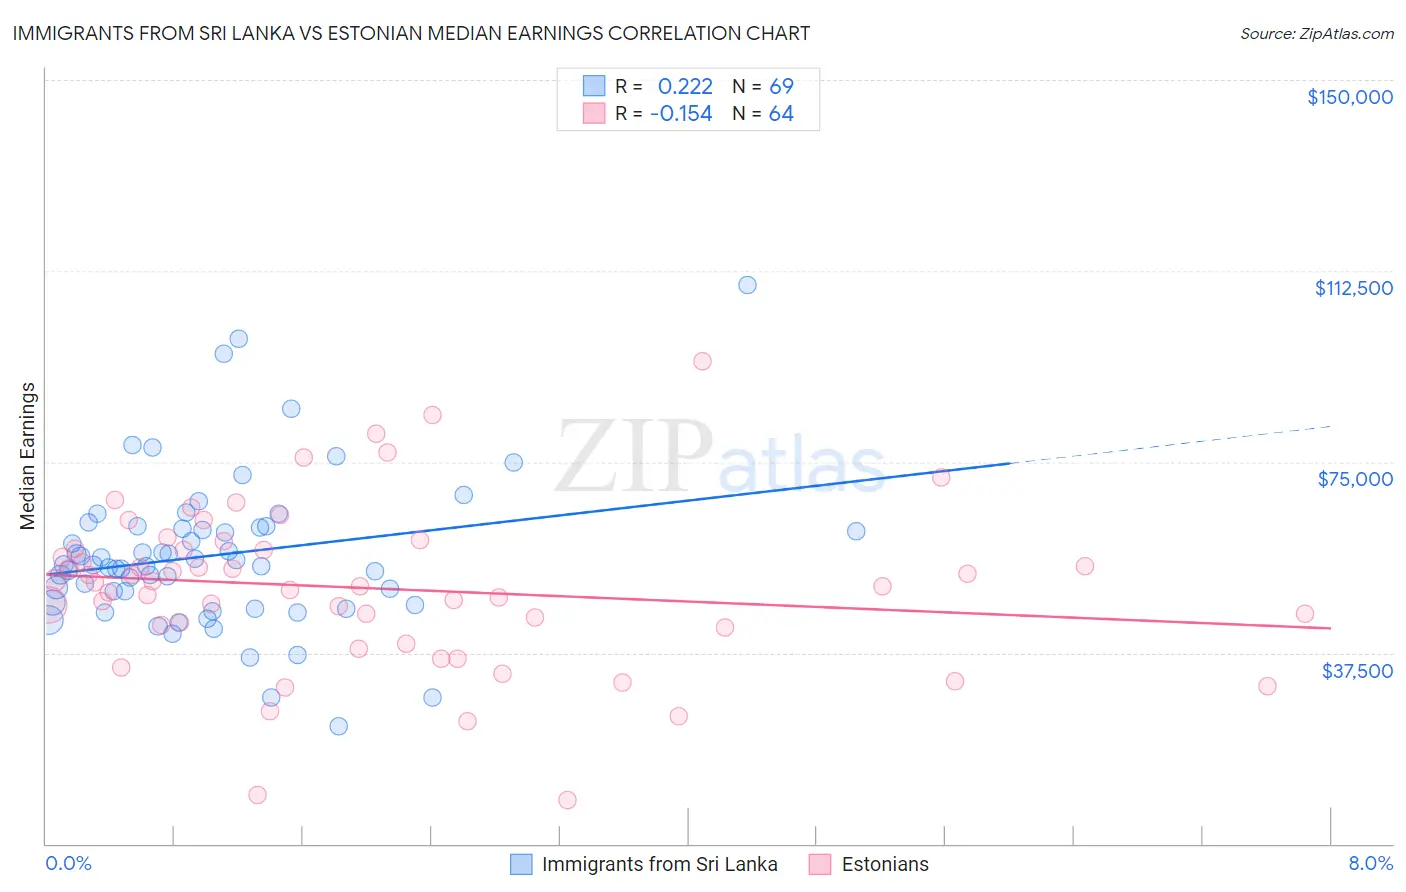
Immigrants from Sri Lanka vs Estonian Median Earnings Correlation Chart
The statistical analysis conducted on geographies consisting of 149,698,351 people shows a weak positive correlation between the proportion of Immigrants from Sri Lanka and median earnings in the United States with a correlation coefficient (R) of 0.222 and weighted average of $53,268. Similarly, the statistical analysis conducted on geographies consisting of 123,525,631 people shows a poor negative correlation between the proportion of Estonians and median earnings in the United States with a correlation coefficient (R) of -0.154 and weighted average of $51,772, a difference of 2.9%.
Median Earnings Correlation Summary
| Measurement | Immigrants from Sri Lanka | Estonian |
| Minimum | $23,025 | $8,672 |
| Maximum | $109,620 | $94,792 |
| Range | $86,595 | $86,120 |
| Mean | $56,667 | $50,194 |
| Median | $54,686 | $50,958 |
| Interquartile 25% (IQ1) | $47,118 | $42,740 |
| Interquartile 75% (IQ3) | $62,136 | $57,865 |
| Interquartile Range (IQR) | $15,018 | $15,125 |
| Standard Deviation (Sample) | $15,005 | $15,990 |
| Standard Deviation (Population) | $14,895 | $15,865 |
Demographics Similar to Immigrants from Sri Lanka and Estonians by Median Earnings
In terms of median earnings, the demographic groups most similar to Immigrants from Sri Lanka are Immigrants from Greece ($53,282, a difference of 0.030%), Immigrants from Switzerland ($53,211, a difference of 0.11%), Immigrants from Denmark ($53,186, a difference of 0.15%), Immigrants from Belarus ($53,043, a difference of 0.42%), and Latvian ($53,001, a difference of 0.50%). Similarly, the demographic groups most similar to Estonians are Immigrants from Norway ($51,758, a difference of 0.030%), Immigrants from Austria ($51,826, a difference of 0.10%), Immigrants from South Africa ($51,850, a difference of 0.15%), Bolivian ($52,005, a difference of 0.45%), and Immigrants from Europe ($52,195, a difference of 0.82%).
| Demographics | Rating | Rank | Median Earnings |
| Immigrants | Greece | 100.0 /100 | #33 | Exceptional $53,282 |
| Immigrants | Sri Lanka | 100.0 /100 | #34 | Exceptional $53,268 |
| Immigrants | Switzerland | 100.0 /100 | #35 | Exceptional $53,211 |
| Immigrants | Denmark | 100.0 /100 | #36 | Exceptional $53,186 |
| Immigrants | Belarus | 100.0 /100 | #37 | Exceptional $53,043 |
| Latvians | 100.0 /100 | #38 | Exceptional $53,001 |
| Immigrants | Turkey | 100.0 /100 | #39 | Exceptional $52,960 |
| Israelis | 100.0 /100 | #40 | Exceptional $52,937 |
| Immigrants | Lithuania | 100.0 /100 | #41 | Exceptional $52,769 |
| Maltese | 100.0 /100 | #42 | Exceptional $52,526 |
| Immigrants | Malaysia | 100.0 /100 | #43 | Exceptional $52,514 |
| Bulgarians | 100.0 /100 | #44 | Exceptional $52,512 |
| Immigrants | Czechoslovakia | 100.0 /100 | #45 | Exceptional $52,361 |
| Bhutanese | 100.0 /100 | #46 | Exceptional $52,297 |
| Australians | 100.0 /100 | #47 | Exceptional $52,294 |
| Immigrants | Europe | 100.0 /100 | #48 | Exceptional $52,195 |
| Bolivians | 100.0 /100 | #49 | Exceptional $52,005 |
| Immigrants | South Africa | 100.0 /100 | #50 | Exceptional $51,850 |
| Immigrants | Austria | 99.9 /100 | #51 | Exceptional $51,826 |
| Estonians | 99.9 /100 | #52 | Exceptional $51,772 |
| Immigrants | Norway | 99.9 /100 | #53 | Exceptional $51,758 |