Marshallese vs Estonian Female Unemployment
COMPARE
Marshallese
Estonian
Female Unemployment
Female Unemployment Comparison
Marshallese
Estonians
5.6%
FEMALE UNEMPLOYMENT
2.3/ 100
METRIC RATING
242nd/ 347
METRIC RANK
5.1%
FEMALE UNEMPLOYMENT
92.1/ 100
METRIC RATING
112th/ 347
METRIC RANK
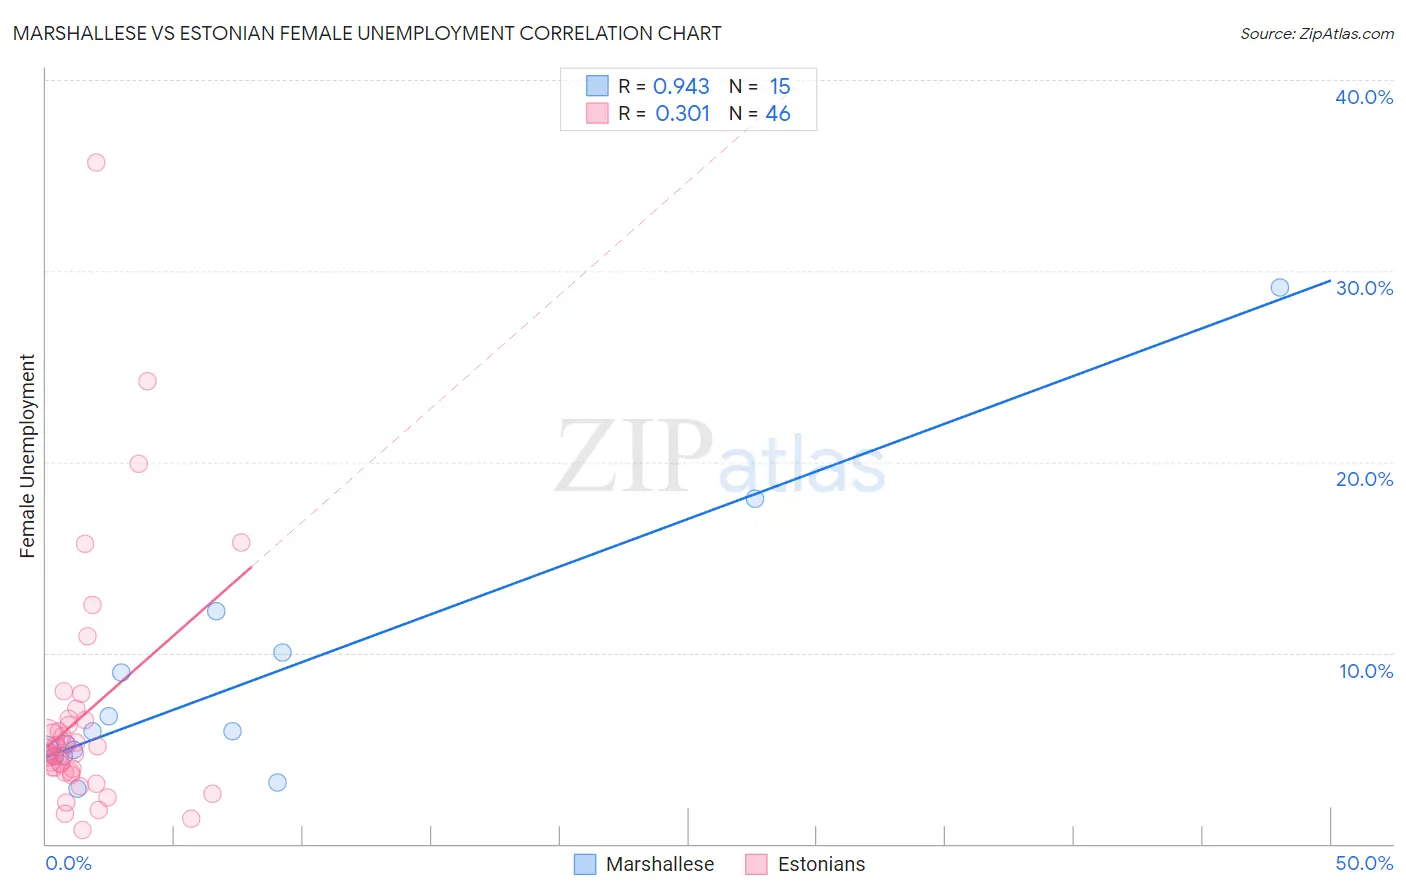
Marshallese vs Estonian Female Unemployment Correlation Chart
The statistical analysis conducted on geographies consisting of 14,756,789 people shows a near-perfect positive correlation between the proportion of Marshallese and unemploymnet rate among females in the United States with a correlation coefficient (R) of 0.943 and weighted average of 5.6%. Similarly, the statistical analysis conducted on geographies consisting of 123,247,163 people shows a mild positive correlation between the proportion of Estonians and unemploymnet rate among females in the United States with a correlation coefficient (R) of 0.301 and weighted average of 5.1%, a difference of 9.7%.
Female Unemployment Correlation Summary
| Measurement | Marshallese | Estonian |
| Minimum | 2.9% | 0.71% |
| Maximum | 29.1% | 35.7% |
| Range | 26.2% | 35.0% |
| Mean | 8.5% | 6.7% |
| Median | 5.9% | 4.7% |
| Interquartile 25% (IQ1) | 4.6% | 3.7% |
| Interquartile 75% (IQ3) | 10.0% | 6.5% |
| Interquartile Range (IQR) | 5.4% | 2.8% |
| Standard Deviation (Sample) | 6.9% | 6.4% |
| Standard Deviation (Population) | 6.7% | 6.3% |
Similar Demographics by Female Unemployment
Demographics Similar to Marshallese by Female Unemployment
In terms of female unemployment, the demographic groups most similar to Marshallese are Spanish American (5.6%, a difference of 0.010%), South American Indian (5.5%, a difference of 0.32%), Immigrants from South America (5.5%, a difference of 0.37%), Aleut (5.5%, a difference of 0.40%), and Sierra Leonean (5.5%, a difference of 0.50%).
| Demographics | Rating | Rank | Female Unemployment |
| Immigrants | Iran | 3.3 /100 | #235 | Tragic 5.5% |
| Immigrants | Cambodia | 3.3 /100 | #236 | Tragic 5.5% |
| Immigrants | Panama | 3.2 /100 | #237 | Tragic 5.5% |
| Sierra Leoneans | 3.2 /100 | #238 | Tragic 5.5% |
| Aleuts | 3.0 /100 | #239 | Tragic 5.5% |
| Immigrants | South America | 2.9 /100 | #240 | Tragic 5.5% |
| South American Indians | 2.8 /100 | #241 | Tragic 5.5% |
| Marshallese | 2.3 /100 | #242 | Tragic 5.6% |
| Spanish Americans | 2.2 /100 | #243 | Tragic 5.6% |
| Immigrants | Liberia | 1.5 /100 | #244 | Tragic 5.6% |
| Guamanians/Chamorros | 1.4 /100 | #245 | Tragic 5.6% |
| Japanese | 1.2 /100 | #246 | Tragic 5.6% |
| Immigrants | Western Asia | 1.1 /100 | #247 | Tragic 5.6% |
| Cree | 1.0 /100 | #248 | Tragic 5.6% |
| Immigrants | Uzbekistan | 1.0 /100 | #249 | Tragic 5.6% |
Demographics Similar to Estonians by Female Unemployment
In terms of female unemployment, the demographic groups most similar to Estonians are Immigrants from Burma/Myanmar (5.1%, a difference of 0.030%), Macedonian (5.1%, a difference of 0.060%), Immigrants from Eastern Africa (5.1%, a difference of 0.16%), Immigrants from Saudi Arabia (5.1%, a difference of 0.18%), and Puget Sound Salish (5.1%, a difference of 0.20%).
| Demographics | Rating | Rank | Female Unemployment |
| Immigrants | England | 93.6 /100 | #105 | Exceptional 5.0% |
| Paraguayans | 93.2 /100 | #106 | Exceptional 5.1% |
| Immigrants | Switzerland | 93.1 /100 | #107 | Exceptional 5.1% |
| Puget Sound Salish | 93.0 /100 | #108 | Exceptional 5.1% |
| Immigrants | Eastern Africa | 92.8 /100 | #109 | Exceptional 5.1% |
| Macedonians | 92.4 /100 | #110 | Exceptional 5.1% |
| Immigrants | Burma/Myanmar | 92.3 /100 | #111 | Exceptional 5.1% |
| Estonians | 92.1 /100 | #112 | Exceptional 5.1% |
| Immigrants | Saudi Arabia | 91.2 /100 | #113 | Exceptional 5.1% |
| Immigrants | Turkey | 91.0 /100 | #114 | Exceptional 5.1% |
| Lebanese | 91.0 /100 | #115 | Exceptional 5.1% |
| Americans | 90.5 /100 | #116 | Exceptional 5.1% |
| Jordanians | 90.3 /100 | #117 | Exceptional 5.1% |
| Immigrants | Croatia | 89.9 /100 | #118 | Excellent 5.1% |
| Immigrants | North Macedonia | 88.3 /100 | #119 | Excellent 5.1% |