Maltese vs Immigrants from England Median Household Income
COMPARE
Maltese
Immigrants from England
Median Household Income
Median Household Income Comparison
Maltese
Immigrants from England
$97,015
MEDIAN HOUSEHOLD INCOME
100.0/ 100
METRIC RATING
40th/ 347
METRIC RANK
$92,098
MEDIAN HOUSEHOLD INCOME
98.9/ 100
METRIC RATING
86th/ 347
METRIC RANK
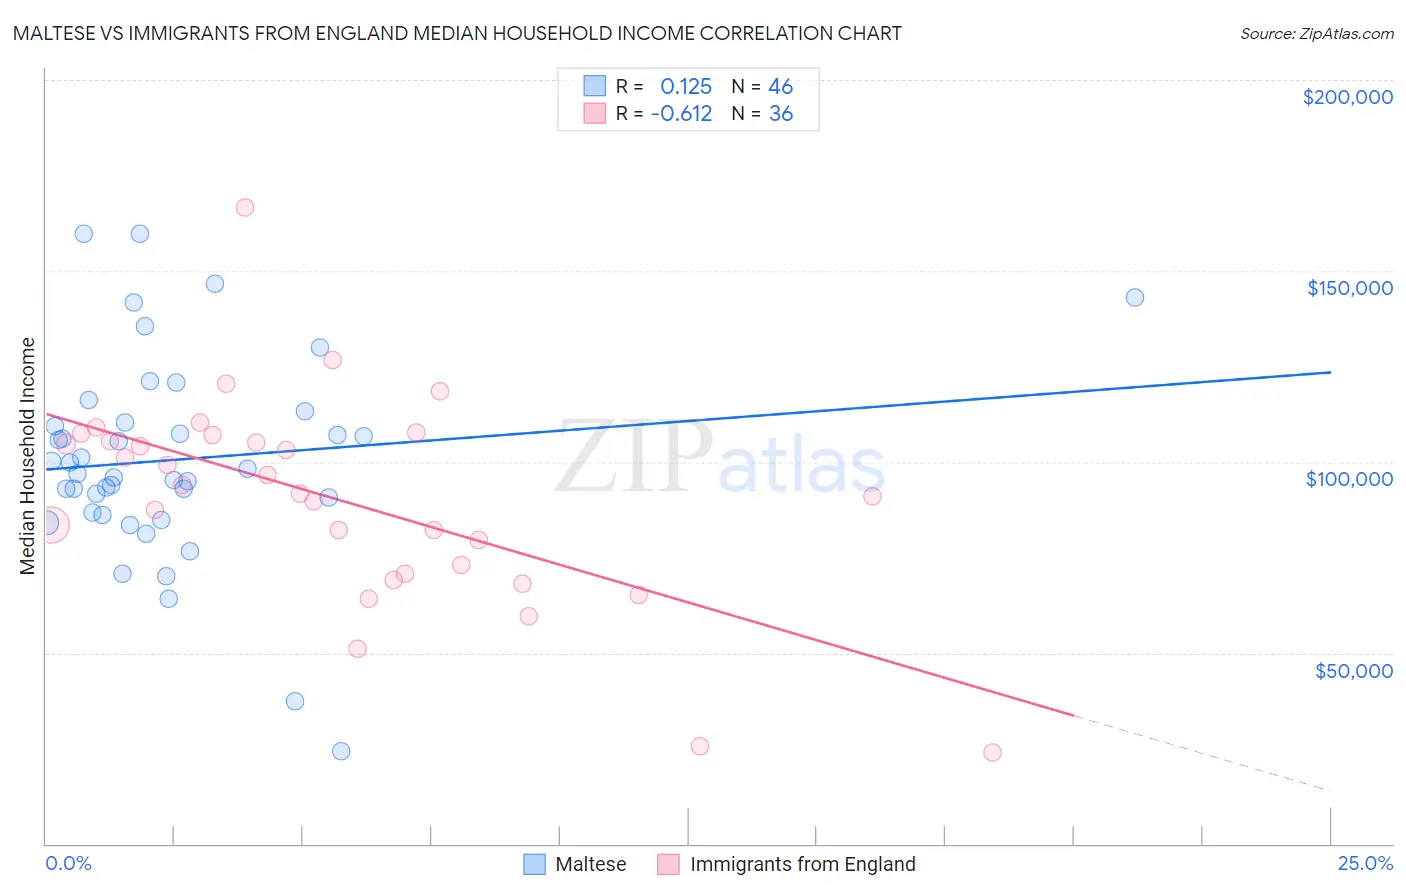
Maltese vs Immigrants from England Median Household Income Correlation Chart
The statistical analysis conducted on geographies consisting of 126,420,319 people shows a poor positive correlation between the proportion of Maltese and median household income in the United States with a correlation coefficient (R) of 0.125 and weighted average of $97,015. Similarly, the statistical analysis conducted on geographies consisting of 391,695,361 people shows a significant negative correlation between the proportion of Immigrants from England and median household income in the United States with a correlation coefficient (R) of -0.612 and weighted average of $92,098, a difference of 5.3%.
Median Household Income Correlation Summary
| Measurement | Maltese | Immigrants from England |
| Minimum | $24,250 | $24,028 |
| Maximum | $159,651 | $166,753 |
| Range | $135,401 | $142,725 |
| Mean | $100,571 | $90,135 |
| Median | $97,403 | $92,873 |
| Interquartile 25% (IQ1) | $86,626 | $71,885 |
| Interquartile 75% (IQ3) | $110,225 | $106,085 |
| Interquartile Range (IQR) | $23,599 | $34,200 |
| Standard Deviation (Sample) | $26,669 | $27,284 |
| Standard Deviation (Population) | $26,378 | $26,903 |
Similar Demographics by Median Household Income
Demographics Similar to Maltese by Median Household Income
In terms of median household income, the demographic groups most similar to Maltese are Afghan ($97,026, a difference of 0.010%), Immigrants from Turkey ($96,964, a difference of 0.050%), Immigrants from Lithuania ($96,836, a difference of 0.18%), Immigrants from France ($96,743, a difference of 0.28%), and Immigrants from Indonesia ($97,297, a difference of 0.29%).
| Demographics | Rating | Rank | Median Household Income |
| Chinese | 100.0 /100 | #33 | Exceptional $98,496 |
| Russians | 100.0 /100 | #34 | Exceptional $98,008 |
| Immigrants | Switzerland | 100.0 /100 | #35 | Exceptional $97,979 |
| Immigrants | Pakistan | 100.0 /100 | #36 | Exceptional $97,528 |
| Latvians | 100.0 /100 | #37 | Exceptional $97,311 |
| Immigrants | Indonesia | 100.0 /100 | #38 | Exceptional $97,297 |
| Afghans | 100.0 /100 | #39 | Exceptional $97,026 |
| Maltese | 100.0 /100 | #40 | Exceptional $97,015 |
| Immigrants | Turkey | 100.0 /100 | #41 | Exceptional $96,964 |
| Immigrants | Lithuania | 99.9 /100 | #42 | Exceptional $96,836 |
| Immigrants | France | 99.9 /100 | #43 | Exceptional $96,743 |
| Immigrants | Greece | 99.9 /100 | #44 | Exceptional $96,675 |
| Israelis | 99.9 /100 | #45 | Exceptional $96,552 |
| Australians | 99.9 /100 | #46 | Exceptional $96,490 |
| Immigrants | Russia | 99.9 /100 | #47 | Exceptional $96,378 |
Demographics Similar to Immigrants from England by Median Household Income
In terms of median household income, the demographic groups most similar to Immigrants from England are Immigrants from Hungary ($92,094, a difference of 0.0%), Immigrants from Canada ($92,029, a difference of 0.080%), Romanian ($91,994, a difference of 0.11%), Assyrian/Chaldean/Syriac ($91,991, a difference of 0.12%), and Immigrants from Vietnam ($91,987, a difference of 0.12%).
| Demographics | Rating | Rank | Median Household Income |
| Sri Lankans | 99.4 /100 | #79 | Exceptional $93,093 |
| Tongans | 99.4 /100 | #80 | Exceptional $93,076 |
| Immigrants | Eastern Europe | 99.4 /100 | #81 | Exceptional $93,051 |
| Immigrants | Spain | 99.3 /100 | #82 | Exceptional $92,732 |
| Italians | 99.1 /100 | #83 | Exceptional $92,475 |
| Immigrants | Argentina | 99.1 /100 | #84 | Exceptional $92,417 |
| Immigrants | Croatia | 99.0 /100 | #85 | Exceptional $92,225 |
| Immigrants | England | 98.9 /100 | #86 | Exceptional $92,098 |
| Immigrants | Hungary | 98.9 /100 | #87 | Exceptional $92,094 |
| Immigrants | Canada | 98.8 /100 | #88 | Exceptional $92,029 |
| Romanians | 98.8 /100 | #89 | Exceptional $91,994 |
| Assyrians/Chaldeans/Syriacs | 98.8 /100 | #90 | Exceptional $91,991 |
| Immigrants | Vietnam | 98.8 /100 | #91 | Exceptional $91,987 |
| Immigrants | Western Europe | 98.8 /100 | #92 | Exceptional $91,936 |
| Immigrants | Lebanon | 98.7 /100 | #93 | Exceptional $91,887 |