Immigrants from Sudan vs Turkish Per Capita Income
COMPARE
Immigrants from Sudan
Turkish
Per Capita Income
Per Capita Income Comparison
Immigrants from Sudan
Turks
$41,986
PER CAPITA INCOME
13.2/ 100
METRIC RATING
209th/ 347
METRIC RANK
$52,391
PER CAPITA INCOME
100.0/ 100
METRIC RATING
31st/ 347
METRIC RANK
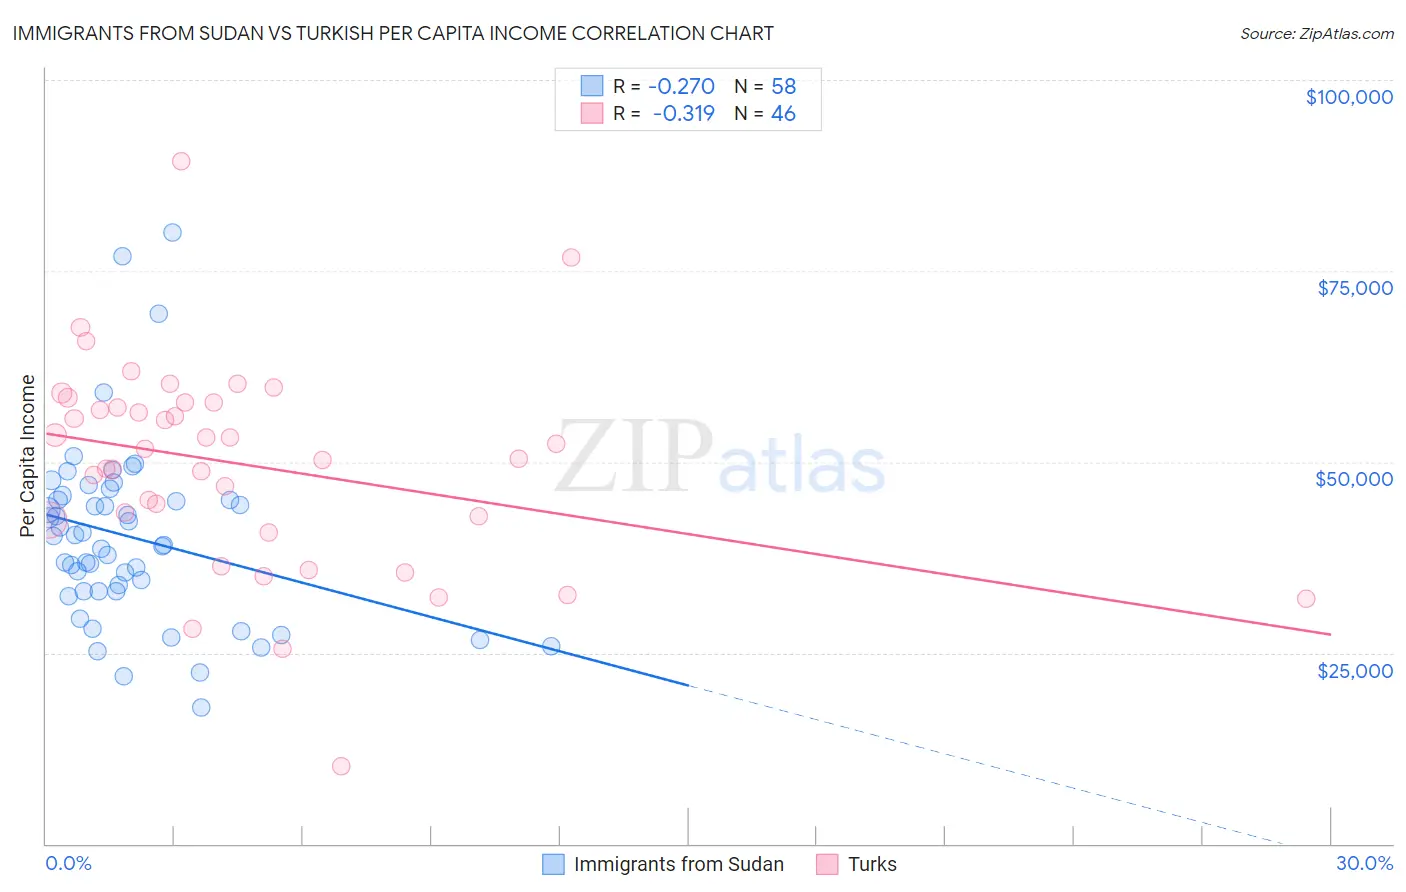
Immigrants from Sudan vs Turkish Per Capita Income Correlation Chart
The statistical analysis conducted on geographies consisting of 118,972,993 people shows a weak negative correlation between the proportion of Immigrants from Sudan and per capita income in the United States with a correlation coefficient (R) of -0.270 and weighted average of $41,986. Similarly, the statistical analysis conducted on geographies consisting of 271,859,983 people shows a mild negative correlation between the proportion of Turks and per capita income in the United States with a correlation coefficient (R) of -0.319 and weighted average of $52,391, a difference of 24.8%.
Per Capita Income Correlation Summary
| Measurement | Immigrants from Sudan | Turkish |
| Minimum | $17,842 | $10,169 |
| Maximum | $80,005 | $89,333 |
| Range | $62,163 | $79,164 |
| Mean | $40,107 | $49,588 |
| Median | $39,743 | $51,043 |
| Interquartile 25% (IQ1) | $33,055 | $42,405 |
| Interquartile 75% (IQ3) | $45,054 | $57,708 |
| Interquartile Range (IQR) | $11,999 | $15,302 |
| Standard Deviation (Sample) | $11,901 | $13,772 |
| Standard Deviation (Population) | $11,798 | $13,621 |
Similar Demographics by Per Capita Income
Demographics Similar to Immigrants from Sudan by Per Capita Income
In terms of per capita income, the demographic groups most similar to Immigrants from Sudan are Ecuadorian ($41,958, a difference of 0.070%), Panamanian ($42,035, a difference of 0.12%), Venezuelan ($42,074, a difference of 0.21%), Immigrants from Panama ($41,853, a difference of 0.32%), and Immigrants from Senegal ($41,830, a difference of 0.37%).
| Demographics | Rating | Rank | Per Capita Income |
| Immigrants | Bosnia and Herzegovina | 17.5 /100 | #202 | Poor $42,278 |
| Spanish | 17.0 /100 | #203 | Poor $42,249 |
| Aleuts | 16.4 /100 | #204 | Poor $42,210 |
| Whites/Caucasians | 15.9 /100 | #205 | Poor $42,180 |
| Ghanaians | 15.7 /100 | #206 | Poor $42,164 |
| Venezuelans | 14.4 /100 | #207 | Poor $42,074 |
| Panamanians | 13.9 /100 | #208 | Poor $42,035 |
| Immigrants | Sudan | 13.2 /100 | #209 | Poor $41,986 |
| Ecuadorians | 12.9 /100 | #210 | Poor $41,958 |
| Immigrants | Panama | 11.6 /100 | #211 | Poor $41,853 |
| Immigrants | Senegal | 11.3 /100 | #212 | Poor $41,830 |
| Immigrants | Venezuela | 10.2 /100 | #213 | Poor $41,727 |
| Immigrants | Bangladesh | 10.1 /100 | #214 | Poor $41,709 |
| Sudanese | 9.9 /100 | #215 | Tragic $41,695 |
| Tongans | 9.9 /100 | #216 | Tragic $41,693 |
Demographics Similar to Turks by Per Capita Income
In terms of per capita income, the demographic groups most similar to Turks are Immigrants from Austria ($52,503, a difference of 0.21%), Immigrants from Norway ($52,217, a difference of 0.33%), Israeli ($52,596, a difference of 0.39%), Latvian ($52,649, a difference of 0.49%), and Immigrants from South Central Asia ($52,660, a difference of 0.51%).
| Demographics | Rating | Rank | Per Capita Income |
| Immigrants | Denmark | 100.0 /100 | #24 | Exceptional $53,799 |
| Immigrants | Japan | 100.0 /100 | #25 | Exceptional $53,359 |
| Russians | 100.0 /100 | #26 | Exceptional $53,154 |
| Immigrants | South Central Asia | 100.0 /100 | #27 | Exceptional $52,660 |
| Latvians | 100.0 /100 | #28 | Exceptional $52,649 |
| Israelis | 100.0 /100 | #29 | Exceptional $52,596 |
| Immigrants | Austria | 100.0 /100 | #30 | Exceptional $52,503 |
| Turks | 100.0 /100 | #31 | Exceptional $52,391 |
| Immigrants | Norway | 100.0 /100 | #32 | Exceptional $52,217 |
| Australians | 100.0 /100 | #33 | Exceptional $52,074 |
| Immigrants | Russia | 100.0 /100 | #34 | Exceptional $52,044 |
| Burmese | 100.0 /100 | #35 | Exceptional $52,005 |
| Immigrants | Greece | 100.0 /100 | #36 | Exceptional $51,891 |
| Estonians | 100.0 /100 | #37 | Exceptional $51,875 |
| Immigrants | Czechoslovakia | 100.0 /100 | #38 | Exceptional $51,770 |