Bulgarian vs Pima Per Capita Income
COMPARE
Bulgarian
Pima
Per Capita Income
Per Capita Income Comparison
Bulgarians
Pima
$50,906
PER CAPITA INCOME
100.0/ 100
METRIC RATING
47th/ 347
METRIC RANK
$30,644
PER CAPITA INCOME
0.0/ 100
METRIC RATING
343rd/ 347
METRIC RANK
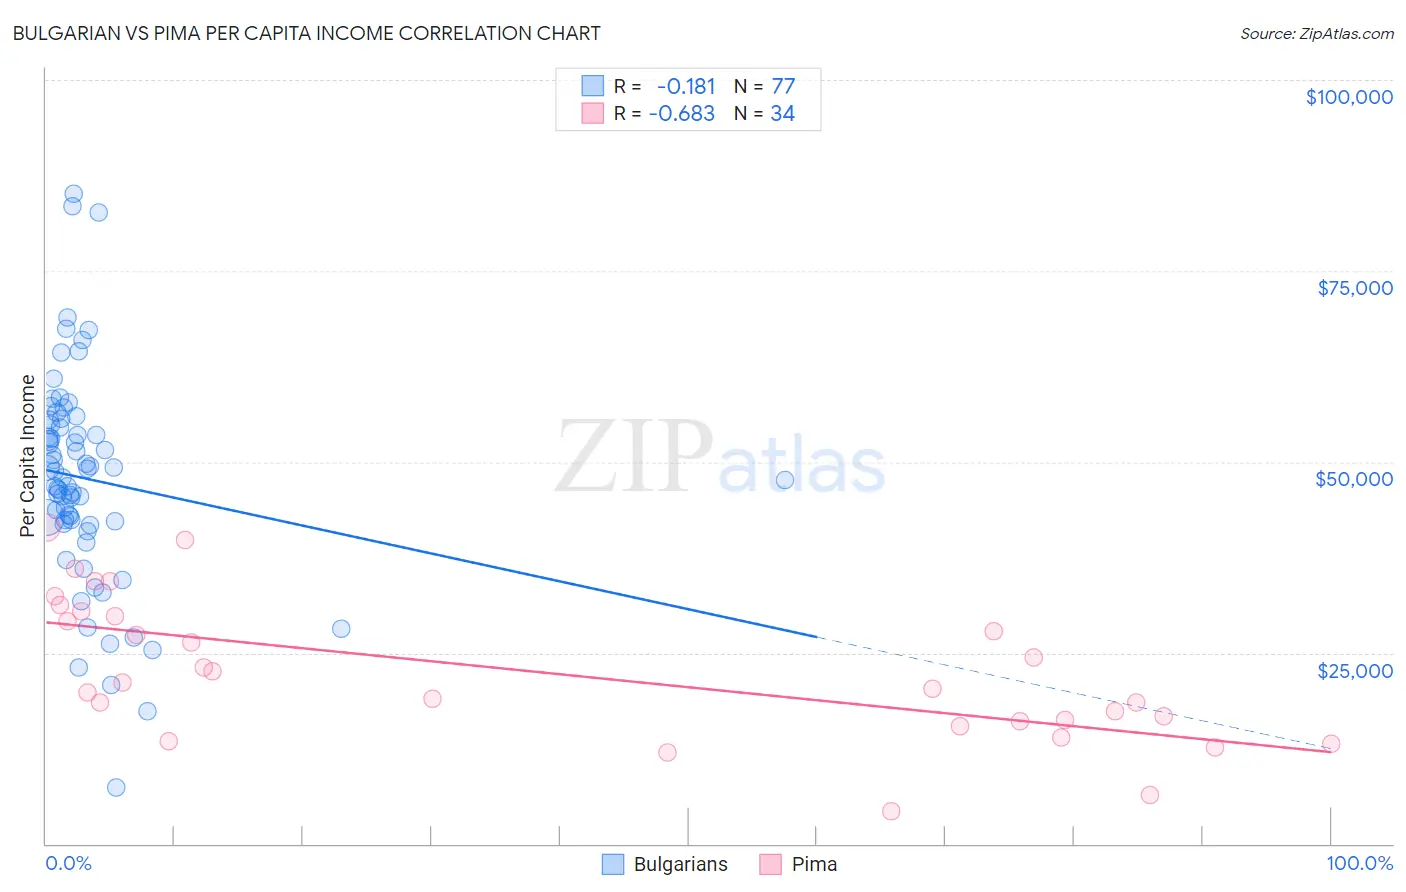
Bulgarian vs Pima Per Capita Income Correlation Chart
The statistical analysis conducted on geographies consisting of 205,631,200 people shows a poor negative correlation between the proportion of Bulgarians and per capita income in the United States with a correlation coefficient (R) of -0.181 and weighted average of $50,906. Similarly, the statistical analysis conducted on geographies consisting of 61,552,682 people shows a significant negative correlation between the proportion of Pima and per capita income in the United States with a correlation coefficient (R) of -0.683 and weighted average of $30,644, a difference of 66.1%.
Per Capita Income Correlation Summary
| Measurement | Bulgarian | Pima |
| Minimum | $7,295 | $4,256 |
| Maximum | $85,161 | $41,474 |
| Range | $77,866 | $37,218 |
| Mean | $47,737 | $22,491 |
| Median | $47,962 | $20,723 |
| Interquartile 25% (IQ1) | $42,061 | $16,036 |
| Interquartile 75% (IQ3) | $55,182 | $29,725 |
| Interquartile Range (IQR) | $13,122 | $13,689 |
| Standard Deviation (Sample) | $13,985 | $9,246 |
| Standard Deviation (Population) | $13,894 | $9,109 |
Similar Demographics by Per Capita Income
Demographics Similar to Bulgarians by Per Capita Income
In terms of per capita income, the demographic groups most similar to Bulgarians are Immigrants from Latvia ($50,914, a difference of 0.020%), Immigrants from Spain ($50,933, a difference of 0.050%), Immigrants from Europe ($50,950, a difference of 0.090%), Immigrants from Serbia ($50,810, a difference of 0.19%), and New Zealander ($50,575, a difference of 0.65%).
| Demographics | Rating | Rank | Per Capita Income |
| Immigrants | Korea | 100.0 /100 | #40 | Exceptional $51,671 |
| Immigrants | South Africa | 100.0 /100 | #41 | Exceptional $51,465 |
| Immigrants | Turkey | 100.0 /100 | #42 | Exceptional $51,368 |
| Immigrants | Lithuania | 100.0 /100 | #43 | Exceptional $51,361 |
| Immigrants | Europe | 100.0 /100 | #44 | Exceptional $50,950 |
| Immigrants | Spain | 100.0 /100 | #45 | Exceptional $50,933 |
| Immigrants | Latvia | 100.0 /100 | #46 | Exceptional $50,914 |
| Bulgarians | 100.0 /100 | #47 | Exceptional $50,906 |
| Immigrants | Serbia | 100.0 /100 | #48 | Exceptional $50,810 |
| New Zealanders | 100.0 /100 | #49 | Exceptional $50,575 |
| Immigrants | Sri Lanka | 100.0 /100 | #50 | Exceptional $50,555 |
| Immigrants | Netherlands | 100.0 /100 | #51 | Exceptional $50,458 |
| Immigrants | Croatia | 99.9 /100 | #52 | Exceptional $50,417 |
| Paraguayans | 99.9 /100 | #53 | Exceptional $50,385 |
| Immigrants | Belarus | 99.9 /100 | #54 | Exceptional $50,303 |
Demographics Similar to Pima by Per Capita Income
In terms of per capita income, the demographic groups most similar to Pima are Yup'ik ($30,518, a difference of 0.41%), Tohono O'odham ($30,256, a difference of 1.3%), Hopi ($31,177, a difference of 1.7%), Puerto Rican ($31,268, a difference of 2.0%), and Lumbee ($29,845, a difference of 2.7%).
| Demographics | Rating | Rank | Per Capita Income |
| Immigrants | Yemen | 0.0 /100 | #333 | Tragic $33,696 |
| Natives/Alaskans | 0.0 /100 | #334 | Tragic $33,279 |
| Yuman | 0.0 /100 | #335 | Tragic $33,236 |
| Yakama | 0.0 /100 | #336 | Tragic $33,009 |
| Houma | 0.0 /100 | #337 | Tragic $32,996 |
| Arapaho | 0.0 /100 | #338 | Tragic $32,345 |
| Pueblo | 0.0 /100 | #339 | Tragic $32,012 |
| Crow | 0.0 /100 | #340 | Tragic $31,729 |
| Puerto Ricans | 0.0 /100 | #341 | Tragic $31,268 |
| Hopi | 0.0 /100 | #342 | Tragic $31,177 |
| Pima | 0.0 /100 | #343 | Tragic $30,644 |
| Yup'ik | 0.0 /100 | #344 | Tragic $30,518 |
| Tohono O'odham | 0.0 /100 | #345 | Tragic $30,256 |
| Lumbee | 0.0 /100 | #346 | Tragic $29,845 |
| Navajo | 0.0 /100 | #347 | Tragic $29,031 |