Immigrants from Germany vs Albanian Per Capita Income
COMPARE
Immigrants from Germany
Albanian
Per Capita Income
Per Capita Income Comparison
Immigrants from Germany
Albanians
$45,751
PER CAPITA INCOME
91.3/ 100
METRIC RATING
127th/ 347
METRIC RANK
$47,379
PER CAPITA INCOME
98.5/ 100
METRIC RATING
94th/ 347
METRIC RANK
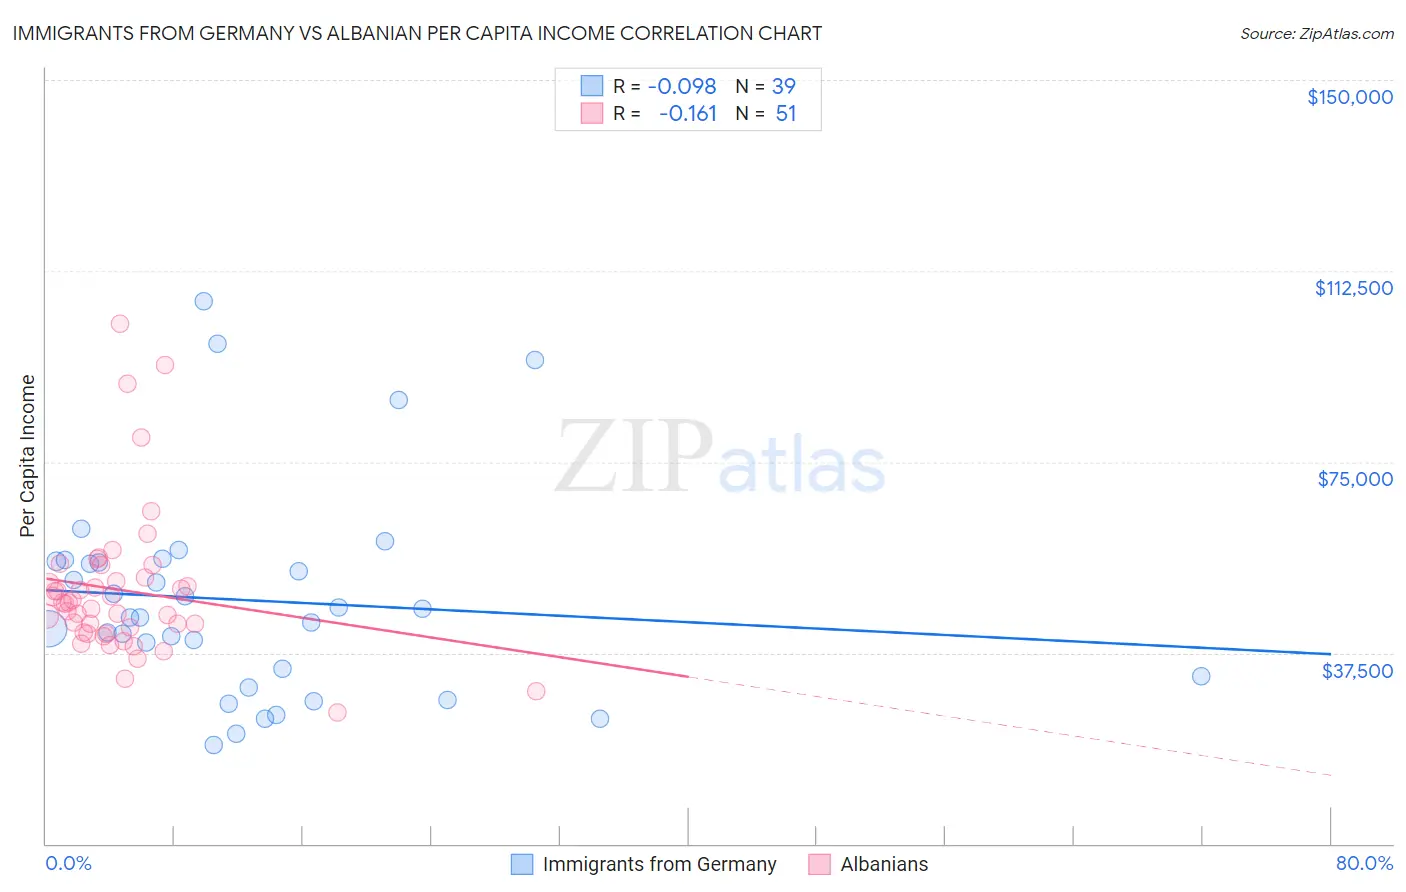
Immigrants from Germany vs Albanian Per Capita Income Correlation Chart
The statistical analysis conducted on geographies consisting of 463,898,714 people shows a slight negative correlation between the proportion of Immigrants from Germany and per capita income in the United States with a correlation coefficient (R) of -0.098 and weighted average of $45,751. Similarly, the statistical analysis conducted on geographies consisting of 193,264,500 people shows a poor negative correlation between the proportion of Albanians and per capita income in the United States with a correlation coefficient (R) of -0.161 and weighted average of $47,379, a difference of 3.6%.
Per Capita Income Correlation Summary
| Measurement | Immigrants from Germany | Albanian |
| Minimum | $19,389 | $25,698 |
| Maximum | $106,492 | $102,102 |
| Range | $87,103 | $76,404 |
| Mean | $47,817 | $49,796 |
| Median | $44,537 | $47,330 |
| Interquartile 25% (IQ1) | $32,967 | $41,568 |
| Interquartile 75% (IQ3) | $55,483 | $52,221 |
| Interquartile Range (IQR) | $22,516 | $10,654 |
| Standard Deviation (Sample) | $20,412 | $14,520 |
| Standard Deviation (Population) | $20,149 | $14,376 |
Similar Demographics by Per Capita Income
Demographics Similar to Immigrants from Germany by Per Capita Income
In terms of per capita income, the demographic groups most similar to Immigrants from Germany are Swedish ($45,750, a difference of 0.0%), Palestinian ($45,790, a difference of 0.090%), Zimbabwean ($45,804, a difference of 0.12%), European ($45,836, a difference of 0.19%), and Luxembourger ($45,663, a difference of 0.19%).
| Demographics | Rating | Rank | Per Capita Income |
| Immigrants | Ethiopia | 92.7 /100 | #120 | Exceptional $45,923 |
| Canadians | 92.2 /100 | #121 | Exceptional $45,858 |
| Moroccans | 92.1 /100 | #122 | Exceptional $45,854 |
| Lebanese | 92.0 /100 | #123 | Exceptional $45,840 |
| Europeans | 92.0 /100 | #124 | Exceptional $45,836 |
| Zimbabweans | 91.7 /100 | #125 | Exceptional $45,804 |
| Palestinians | 91.6 /100 | #126 | Exceptional $45,790 |
| Immigrants | Germany | 91.3 /100 | #127 | Exceptional $45,751 |
| Swedes | 91.3 /100 | #128 | Exceptional $45,750 |
| Luxembourgers | 90.4 /100 | #129 | Exceptional $45,663 |
| Arabs | 90.4 /100 | #130 | Exceptional $45,662 |
| Immigrants | North Macedonia | 90.0 /100 | #131 | Exceptional $45,622 |
| Jordanians | 89.9 /100 | #132 | Excellent $45,605 |
| Pakistanis | 89.7 /100 | #133 | Excellent $45,587 |
| Slovenes | 89.6 /100 | #134 | Excellent $45,581 |
Demographics Similar to Albanians by Per Capita Income
In terms of per capita income, the demographic groups most similar to Albanians are Immigrants from Zimbabwe ($47,394, a difference of 0.030%), Immigrants from Egypt ($47,361, a difference of 0.040%), Alsatian ($47,284, a difference of 0.20%), Immigrants from Moldova ($47,489, a difference of 0.23%), and Carpatho Rusyn ($47,248, a difference of 0.28%).
| Demographics | Rating | Rank | Per Capita Income |
| Ukrainians | 99.3 /100 | #87 | Exceptional $48,014 |
| Croatians | 99.0 /100 | #88 | Exceptional $47,742 |
| Northern Europeans | 98.9 /100 | #89 | Exceptional $47,698 |
| Italians | 98.8 /100 | #90 | Exceptional $47,574 |
| Macedonians | 98.8 /100 | #91 | Exceptional $47,573 |
| Immigrants | Moldova | 98.7 /100 | #92 | Exceptional $47,489 |
| Immigrants | Zimbabwe | 98.5 /100 | #93 | Exceptional $47,394 |
| Albanians | 98.5 /100 | #94 | Exceptional $47,379 |
| Immigrants | Egypt | 98.5 /100 | #95 | Exceptional $47,361 |
| Alsatians | 98.3 /100 | #96 | Exceptional $47,284 |
| Carpatho Rusyns | 98.2 /100 | #97 | Exceptional $47,248 |
| Immigrants | Pakistan | 97.9 /100 | #98 | Exceptional $47,084 |
| Laotians | 97.8 /100 | #99 | Exceptional $47,041 |
| Immigrants | Lebanon | 97.5 /100 | #100 | Exceptional $46,938 |
| Immigrants | Uzbekistan | 97.5 /100 | #101 | Exceptional $46,929 |