Lithuanian vs Immigrants from Bangladesh Householder Income Ages 45 - 64 years
COMPARE
Lithuanian
Immigrants from Bangladesh
Householder Income Ages 45 - 64 years
Householder Income Ages 45 - 64 years Comparison
Lithuanians
Immigrants from Bangladesh
$112,484
HOUSEHOLDER INCOME AGES 45 - 64 YEARS
99.8/ 100
METRIC RATING
55th/ 347
METRIC RANK
$92,208
HOUSEHOLDER INCOME AGES 45 - 64 YEARS
1.7/ 100
METRIC RATING
237th/ 347
METRIC RANK
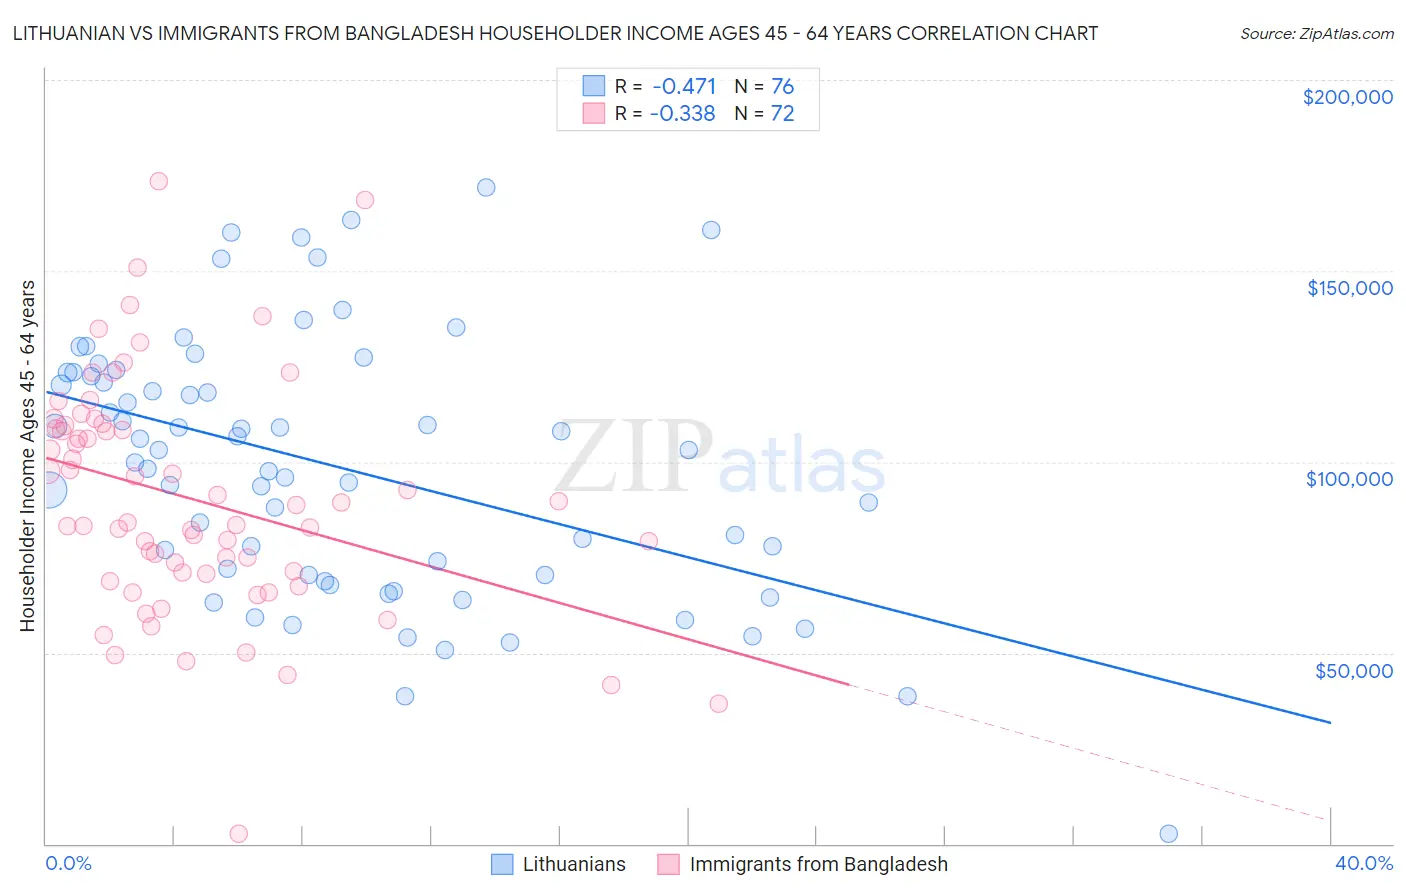
Lithuanian vs Immigrants from Bangladesh Householder Income Ages 45 - 64 years Correlation Chart
The statistical analysis conducted on geographies consisting of 421,155,737 people shows a moderate negative correlation between the proportion of Lithuanians and household income with householder between the ages 45 and 64 in the United States with a correlation coefficient (R) of -0.471 and weighted average of $112,484. Similarly, the statistical analysis conducted on geographies consisting of 203,437,833 people shows a mild negative correlation between the proportion of Immigrants from Bangladesh and household income with householder between the ages 45 and 64 in the United States with a correlation coefficient (R) of -0.338 and weighted average of $92,208, a difference of 22.0%.
Householder Income Ages 45 - 64 years Correlation Summary
| Measurement | Lithuanian | Immigrants from Bangladesh |
| Minimum | $2,499 | $2,499 |
| Maximum | $171,736 | $173,347 |
| Range | $169,237 | $170,848 |
| Mean | $98,659 | $90,304 |
| Median | $101,418 | $86,504 |
| Interquartile 25% (IQ1) | $70,474 | $70,928 |
| Interquartile 75% (IQ3) | $122,894 | $109,175 |
| Interquartile Range (IQR) | $52,420 | $38,247 |
| Standard Deviation (Sample) | $34,121 | $30,699 |
| Standard Deviation (Population) | $33,896 | $30,485 |
Similar Demographics by Householder Income Ages 45 - 64 years
Demographics Similar to Lithuanians by Householder Income Ages 45 - 64 years
In terms of householder income ages 45 - 64 years, the demographic groups most similar to Lithuanians are Greek ($112,630, a difference of 0.13%), Afghan ($112,676, a difference of 0.17%), Egyptian ($112,256, a difference of 0.20%), Immigrants from Malaysia ($112,796, a difference of 0.28%), and Immigrants from Scotland ($112,175, a difference of 0.28%).
| Demographics | Rating | Rank | Householder Income Ages 45 - 64 years |
| Immigrants | Indonesia | 99.9 /100 | #48 | Exceptional $113,519 |
| Immigrants | Russia | 99.8 /100 | #49 | Exceptional $113,215 |
| Immigrants | Austria | 99.8 /100 | #50 | Exceptional $113,140 |
| Immigrants | South Africa | 99.8 /100 | #51 | Exceptional $112,886 |
| Immigrants | Malaysia | 99.8 /100 | #52 | Exceptional $112,796 |
| Afghans | 99.8 /100 | #53 | Exceptional $112,676 |
| Greeks | 99.8 /100 | #54 | Exceptional $112,630 |
| Lithuanians | 99.8 /100 | #55 | Exceptional $112,484 |
| Egyptians | 99.7 /100 | #56 | Exceptional $112,256 |
| Immigrants | Scotland | 99.7 /100 | #57 | Exceptional $112,175 |
| Soviet Union | 99.7 /100 | #58 | Exceptional $112,008 |
| Immigrants | Europe | 99.7 /100 | #59 | Exceptional $111,984 |
| Immigrants | Netherlands | 99.7 /100 | #60 | Exceptional $111,982 |
| Immigrants | Czechoslovakia | 99.7 /100 | #61 | Exceptional $111,914 |
| Immigrants | Norway | 99.7 /100 | #62 | Exceptional $111,669 |
Demographics Similar to Immigrants from Bangladesh by Householder Income Ages 45 - 64 years
In terms of householder income ages 45 - 64 years, the demographic groups most similar to Immigrants from Bangladesh are Immigrants from Western Africa ($92,384, a difference of 0.19%), Pennsylvania German ($91,956, a difference of 0.27%), Nicaraguan ($92,554, a difference of 0.37%), Immigrants from Ecuador ($91,462, a difference of 0.82%), and Immigrants from Burma/Myanmar ($91,385, a difference of 0.90%).
| Demographics | Rating | Rank | Householder Income Ages 45 - 64 years |
| Immigrants | Sudan | 3.6 /100 | #230 | Tragic $93,781 |
| Ecuadorians | 3.6 /100 | #231 | Tragic $93,739 |
| Sudanese | 3.5 /100 | #232 | Tragic $93,718 |
| Nepalese | 3.0 /100 | #233 | Tragic $93,355 |
| Immigrants | El Salvador | 2.7 /100 | #234 | Tragic $93,176 |
| Nicaraguans | 2.0 /100 | #235 | Tragic $92,554 |
| Immigrants | Western Africa | 1.8 /100 | #236 | Tragic $92,384 |
| Immigrants | Bangladesh | 1.7 /100 | #237 | Tragic $92,208 |
| Pennsylvania Germans | 1.5 /100 | #238 | Tragic $91,956 |
| Immigrants | Ecuador | 1.2 /100 | #239 | Tragic $91,462 |
| Immigrants | Burma/Myanmar | 1.1 /100 | #240 | Tragic $91,385 |
| Trinidadians and Tobagonians | 1.1 /100 | #241 | Tragic $91,357 |
| Inupiat | 1.1 /100 | #242 | Tragic $91,355 |
| Immigrants | Trinidad and Tobago | 1.1 /100 | #243 | Tragic $91,347 |
| Immigrants | Middle Africa | 1.1 /100 | #244 | Tragic $91,293 |