Immigrants from Cuba vs Immigrants from Bangladesh Householder Income Ages 45 - 64 years
COMPARE
Immigrants from Cuba
Immigrants from Bangladesh
Householder Income Ages 45 - 64 years
Householder Income Ages 45 - 64 years Comparison
Immigrants from Cuba
Immigrants from Bangladesh
$80,662
HOUSEHOLDER INCOME AGES 45 - 64 YEARS
0.0/ 100
METRIC RATING
325th/ 347
METRIC RANK
$92,208
HOUSEHOLDER INCOME AGES 45 - 64 YEARS
1.7/ 100
METRIC RATING
237th/ 347
METRIC RANK
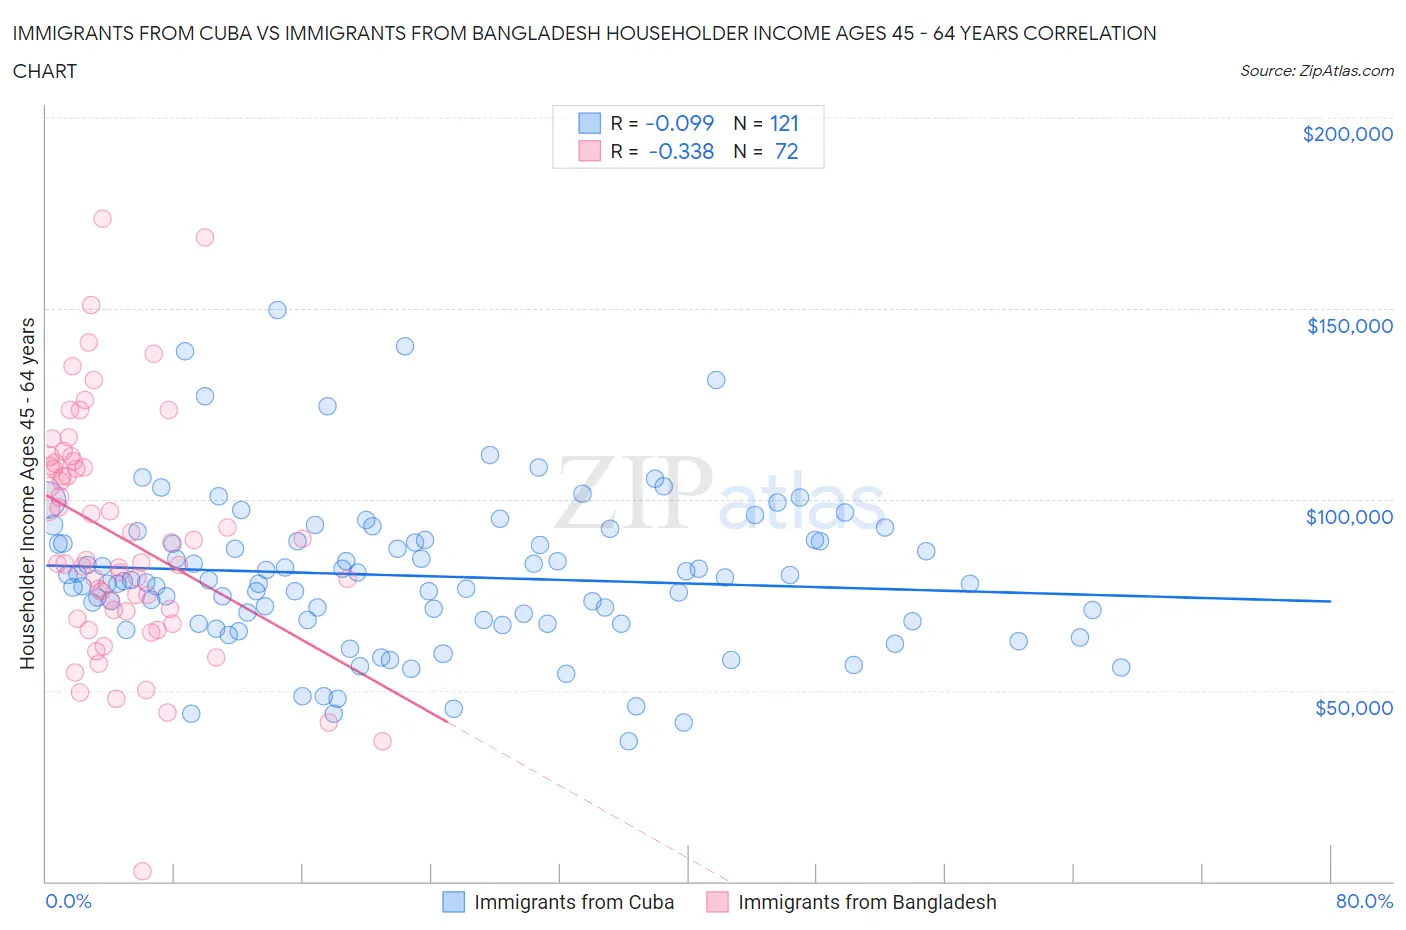
Immigrants from Cuba vs Immigrants from Bangladesh Householder Income Ages 45 - 64 years Correlation Chart
The statistical analysis conducted on geographies consisting of 325,648,995 people shows a slight negative correlation between the proportion of Immigrants from Cuba and household income with householder between the ages 45 and 64 in the United States with a correlation coefficient (R) of -0.099 and weighted average of $80,662. Similarly, the statistical analysis conducted on geographies consisting of 203,437,833 people shows a mild negative correlation between the proportion of Immigrants from Bangladesh and household income with householder between the ages 45 and 64 in the United States with a correlation coefficient (R) of -0.338 and weighted average of $92,208, a difference of 14.3%.
Householder Income Ages 45 - 64 years Correlation Summary
| Measurement | Immigrants from Cuba | Immigrants from Bangladesh |
| Minimum | $36,806 | $2,499 |
| Maximum | $149,489 | $173,347 |
| Range | $112,683 | $170,848 |
| Mean | $79,969 | $90,304 |
| Median | $78,597 | $86,504 |
| Interquartile 25% (IQ1) | $67,753 | $70,928 |
| Interquartile 75% (IQ3) | $89,231 | $109,175 |
| Interquartile Range (IQR) | $21,478 | $38,247 |
| Standard Deviation (Sample) | $20,104 | $30,699 |
| Standard Deviation (Population) | $20,021 | $30,485 |
Similar Demographics by Householder Income Ages 45 - 64 years
Demographics Similar to Immigrants from Cuba by Householder Income Ages 45 - 64 years
In terms of householder income ages 45 - 64 years, the demographic groups most similar to Immigrants from Cuba are Dominican ($80,623, a difference of 0.050%), Yup'ik ($81,000, a difference of 0.42%), Seminole ($80,077, a difference of 0.73%), Bahamian ($81,369, a difference of 0.88%), and Native/Alaskan ($79,816, a difference of 1.1%).
| Demographics | Rating | Rank | Householder Income Ages 45 - 64 years |
| Choctaw | 0.0 /100 | #318 | Tragic $82,287 |
| Chickasaw | 0.0 /100 | #319 | Tragic $82,193 |
| Apache | 0.0 /100 | #320 | Tragic $82,184 |
| Yuman | 0.0 /100 | #321 | Tragic $82,139 |
| Sioux | 0.0 /100 | #322 | Tragic $81,750 |
| Bahamians | 0.0 /100 | #323 | Tragic $81,369 |
| Yup'ik | 0.0 /100 | #324 | Tragic $81,000 |
| Immigrants | Cuba | 0.0 /100 | #325 | Tragic $80,662 |
| Dominicans | 0.0 /100 | #326 | Tragic $80,623 |
| Seminole | 0.0 /100 | #327 | Tragic $80,077 |
| Natives/Alaskans | 0.0 /100 | #328 | Tragic $79,816 |
| Dutch West Indians | 0.0 /100 | #329 | Tragic $79,171 |
| Creek | 0.0 /100 | #330 | Tragic $78,960 |
| Immigrants | Dominican Republic | 0.0 /100 | #331 | Tragic $78,836 |
| Blacks/African Americans | 0.0 /100 | #332 | Tragic $78,556 |
Demographics Similar to Immigrants from Bangladesh by Householder Income Ages 45 - 64 years
In terms of householder income ages 45 - 64 years, the demographic groups most similar to Immigrants from Bangladesh are Immigrants from Western Africa ($92,384, a difference of 0.19%), Pennsylvania German ($91,956, a difference of 0.27%), Nicaraguan ($92,554, a difference of 0.37%), Immigrants from Ecuador ($91,462, a difference of 0.82%), and Immigrants from Burma/Myanmar ($91,385, a difference of 0.90%).
| Demographics | Rating | Rank | Householder Income Ages 45 - 64 years |
| Immigrants | Sudan | 3.6 /100 | #230 | Tragic $93,781 |
| Ecuadorians | 3.6 /100 | #231 | Tragic $93,739 |
| Sudanese | 3.5 /100 | #232 | Tragic $93,718 |
| Nepalese | 3.0 /100 | #233 | Tragic $93,355 |
| Immigrants | El Salvador | 2.7 /100 | #234 | Tragic $93,176 |
| Nicaraguans | 2.0 /100 | #235 | Tragic $92,554 |
| Immigrants | Western Africa | 1.8 /100 | #236 | Tragic $92,384 |
| Immigrants | Bangladesh | 1.7 /100 | #237 | Tragic $92,208 |
| Pennsylvania Germans | 1.5 /100 | #238 | Tragic $91,956 |
| Immigrants | Ecuador | 1.2 /100 | #239 | Tragic $91,462 |
| Immigrants | Burma/Myanmar | 1.1 /100 | #240 | Tragic $91,385 |
| Trinidadians and Tobagonians | 1.1 /100 | #241 | Tragic $91,357 |
| Inupiat | 1.1 /100 | #242 | Tragic $91,355 |
| Immigrants | Trinidad and Tobago | 1.1 /100 | #243 | Tragic $91,347 |
| Immigrants | Middle Africa | 1.1 /100 | #244 | Tragic $91,293 |