Finnish vs Immigrants from Bangladesh Householder Income Ages 45 - 64 years
COMPARE
Finnish
Immigrants from Bangladesh
Householder Income Ages 45 - 64 years
Householder Income Ages 45 - 64 years Comparison
Finns
Immigrants from Bangladesh
$99,904
HOUSEHOLDER INCOME AGES 45 - 64 YEARS
44.8/ 100
METRIC RATING
182nd/ 347
METRIC RANK
$92,208
HOUSEHOLDER INCOME AGES 45 - 64 YEARS
1.7/ 100
METRIC RATING
237th/ 347
METRIC RANK
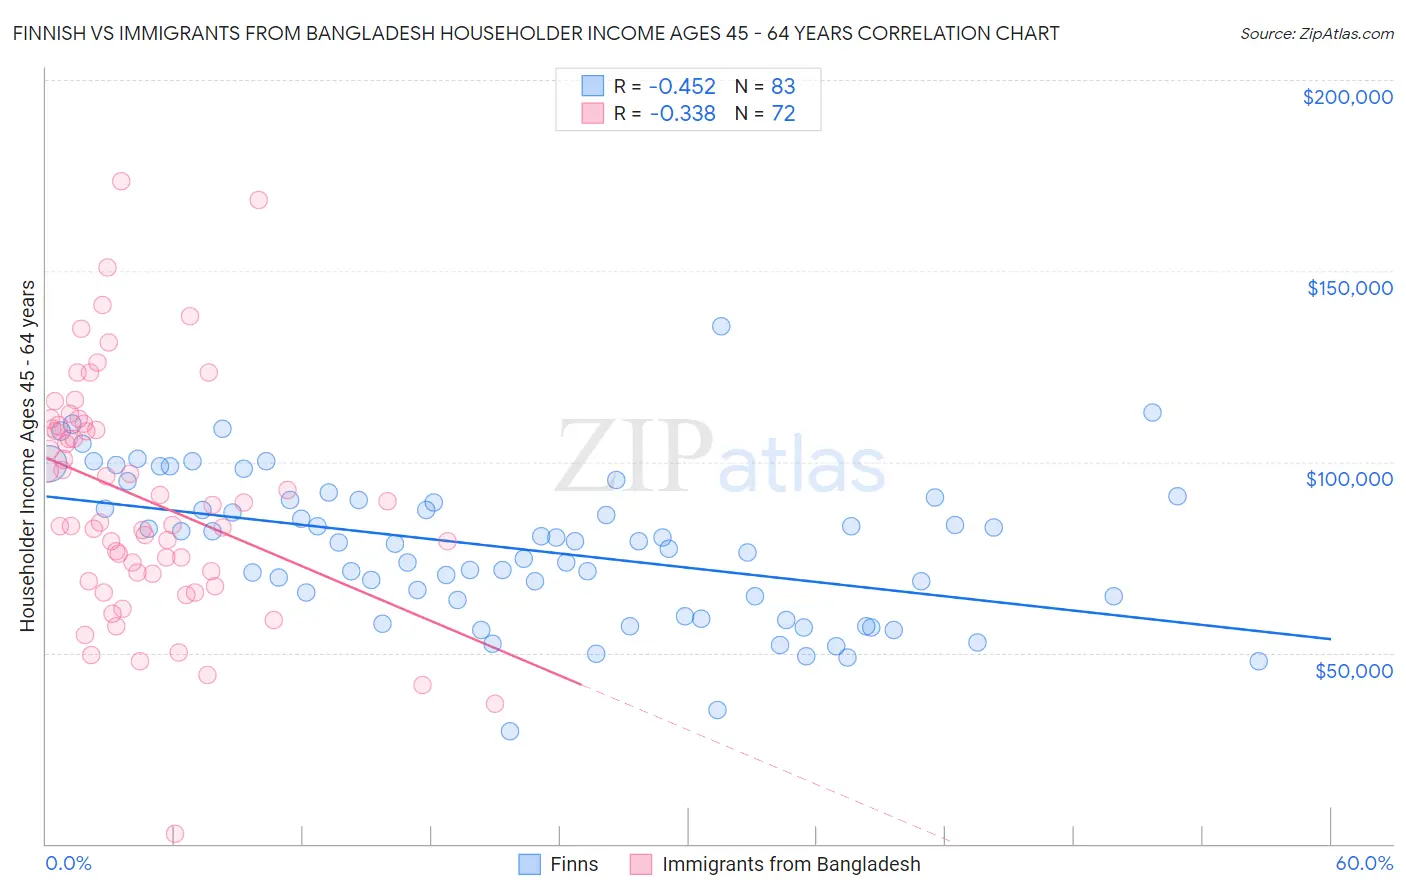
Finnish vs Immigrants from Bangladesh Householder Income Ages 45 - 64 years Correlation Chart
The statistical analysis conducted on geographies consisting of 404,016,937 people shows a moderate negative correlation between the proportion of Finns and household income with householder between the ages 45 and 64 in the United States with a correlation coefficient (R) of -0.452 and weighted average of $99,904. Similarly, the statistical analysis conducted on geographies consisting of 203,437,833 people shows a mild negative correlation between the proportion of Immigrants from Bangladesh and household income with householder between the ages 45 and 64 in the United States with a correlation coefficient (R) of -0.338 and weighted average of $92,208, a difference of 8.4%.
Householder Income Ages 45 - 64 years Correlation Summary
| Measurement | Finnish | Immigrants from Bangladesh |
| Minimum | $29,583 | $2,499 |
| Maximum | $135,625 | $173,347 |
| Range | $106,042 | $170,848 |
| Mean | $77,268 | $90,304 |
| Median | $78,849 | $86,504 |
| Interquartile 25% (IQ1) | $63,712 | $70,928 |
| Interquartile 75% (IQ3) | $90,163 | $109,175 |
| Interquartile Range (IQR) | $26,451 | $38,247 |
| Standard Deviation (Sample) | $19,265 | $30,699 |
| Standard Deviation (Population) | $19,148 | $30,485 |
Similar Demographics by Householder Income Ages 45 - 64 years
Demographics Similar to Finns by Householder Income Ages 45 - 64 years
In terms of householder income ages 45 - 64 years, the demographic groups most similar to Finns are Spaniard ($99,889, a difference of 0.010%), Immigrants ($99,943, a difference of 0.040%), French ($99,824, a difference of 0.080%), Colombian ($99,772, a difference of 0.13%), and Aleut ($100,052, a difference of 0.15%).
| Demographics | Rating | Rank | Householder Income Ages 45 - 64 years |
| Germans | 48.8 /100 | #175 | Average $100,224 |
| Immigrants | Costa Rica | 47.7 /100 | #176 | Average $100,141 |
| Moroccans | 47.7 /100 | #177 | Average $100,138 |
| Immigrants | Cameroon | 47.0 /100 | #178 | Average $100,084 |
| Belgians | 46.7 /100 | #179 | Average $100,060 |
| Aleuts | 46.6 /100 | #180 | Average $100,052 |
| Immigrants | Immigrants | 45.3 /100 | #181 | Average $99,943 |
| Finns | 44.8 /100 | #182 | Average $99,904 |
| Spaniards | 44.6 /100 | #183 | Average $99,889 |
| French | 43.8 /100 | #184 | Average $99,824 |
| Colombians | 43.2 /100 | #185 | Average $99,772 |
| Dutch | 41.7 /100 | #186 | Average $99,650 |
| Iraqis | 38.5 /100 | #187 | Fair $99,387 |
| Immigrants | Portugal | 36.3 /100 | #188 | Fair $99,203 |
| Immigrants | South America | 35.4 /100 | #189 | Fair $99,126 |
Demographics Similar to Immigrants from Bangladesh by Householder Income Ages 45 - 64 years
In terms of householder income ages 45 - 64 years, the demographic groups most similar to Immigrants from Bangladesh are Immigrants from Western Africa ($92,384, a difference of 0.19%), Pennsylvania German ($91,956, a difference of 0.27%), Nicaraguan ($92,554, a difference of 0.37%), Immigrants from Ecuador ($91,462, a difference of 0.82%), and Immigrants from Burma/Myanmar ($91,385, a difference of 0.90%).
| Demographics | Rating | Rank | Householder Income Ages 45 - 64 years |
| Immigrants | Sudan | 3.6 /100 | #230 | Tragic $93,781 |
| Ecuadorians | 3.6 /100 | #231 | Tragic $93,739 |
| Sudanese | 3.5 /100 | #232 | Tragic $93,718 |
| Nepalese | 3.0 /100 | #233 | Tragic $93,355 |
| Immigrants | El Salvador | 2.7 /100 | #234 | Tragic $93,176 |
| Nicaraguans | 2.0 /100 | #235 | Tragic $92,554 |
| Immigrants | Western Africa | 1.8 /100 | #236 | Tragic $92,384 |
| Immigrants | Bangladesh | 1.7 /100 | #237 | Tragic $92,208 |
| Pennsylvania Germans | 1.5 /100 | #238 | Tragic $91,956 |
| Immigrants | Ecuador | 1.2 /100 | #239 | Tragic $91,462 |
| Immigrants | Burma/Myanmar | 1.1 /100 | #240 | Tragic $91,385 |
| Trinidadians and Tobagonians | 1.1 /100 | #241 | Tragic $91,357 |
| Inupiat | 1.1 /100 | #242 | Tragic $91,355 |
| Immigrants | Trinidad and Tobago | 1.1 /100 | #243 | Tragic $91,347 |
| Immigrants | Middle Africa | 1.1 /100 | #244 | Tragic $91,293 |