Lithuanian vs Immigrants from Switzerland Householder Income Ages 45 - 64 years
COMPARE
Lithuanian
Immigrants from Switzerland
Householder Income Ages 45 - 64 years
Householder Income Ages 45 - 64 years Comparison
Lithuanians
Immigrants from Switzerland
$112,484
HOUSEHOLDER INCOME AGES 45 - 64 YEARS
99.8/ 100
METRIC RATING
55th/ 347
METRIC RANK
$115,934
HOUSEHOLDER INCOME AGES 45 - 64 YEARS
100.0/ 100
METRIC RATING
36th/ 347
METRIC RANK
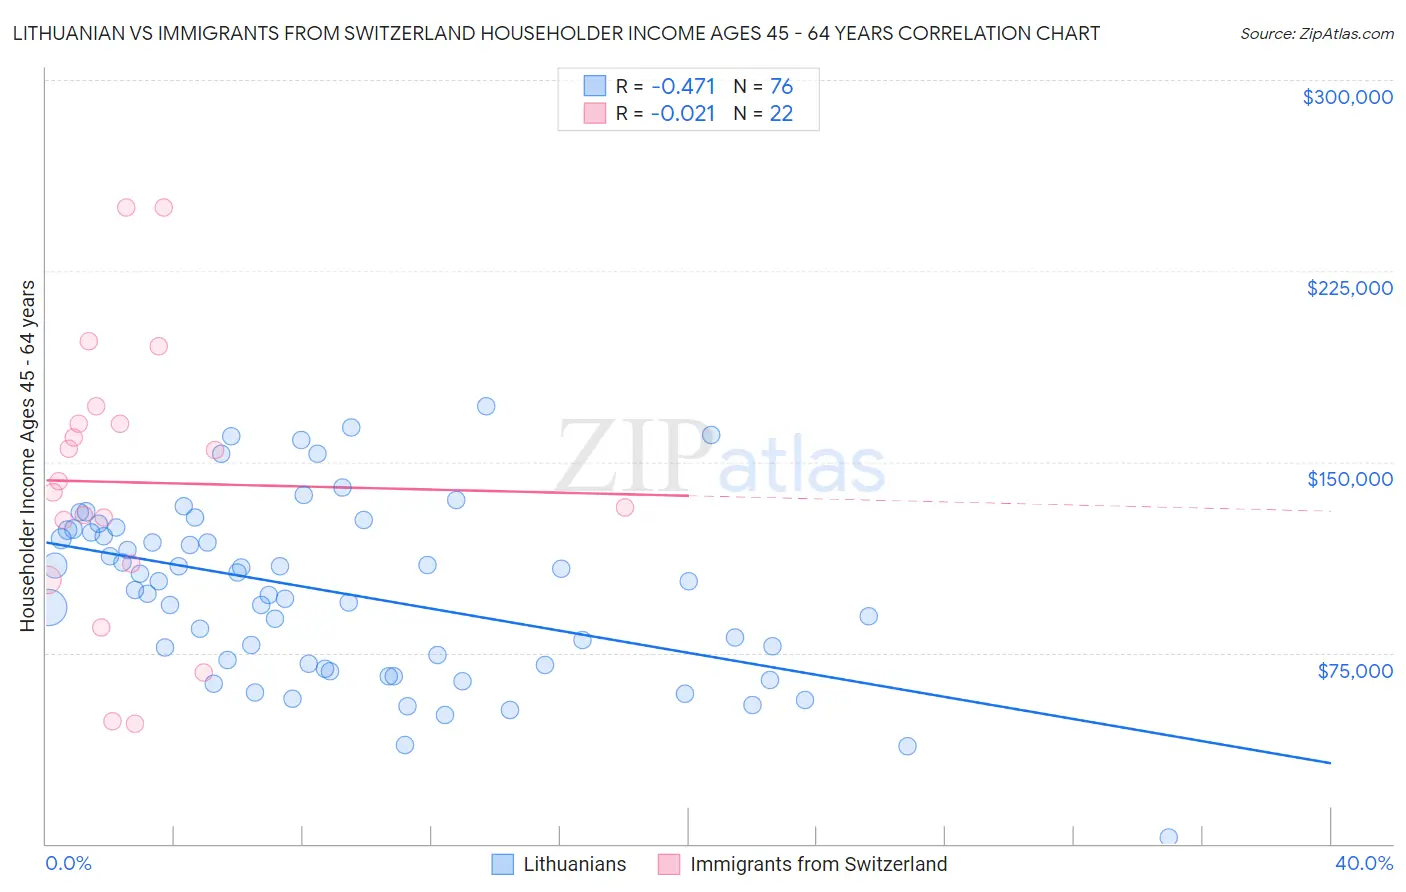
Lithuanian vs Immigrants from Switzerland Householder Income Ages 45 - 64 years Correlation Chart
The statistical analysis conducted on geographies consisting of 421,155,737 people shows a moderate negative correlation between the proportion of Lithuanians and household income with householder between the ages 45 and 64 in the United States with a correlation coefficient (R) of -0.471 and weighted average of $112,484. Similarly, the statistical analysis conducted on geographies consisting of 148,019,607 people shows no correlation between the proportion of Immigrants from Switzerland and household income with householder between the ages 45 and 64 in the United States with a correlation coefficient (R) of -0.021 and weighted average of $115,934, a difference of 3.1%.
Householder Income Ages 45 - 64 years Correlation Summary
| Measurement | Lithuanian | Immigrants from Switzerland |
| Minimum | $2,499 | $47,188 |
| Maximum | $171,736 | $250,001 |
| Range | $169,237 | $202,813 |
| Mean | $98,659 | $141,958 |
| Median | $101,418 | $140,273 |
| Interquartile 25% (IQ1) | $70,474 | $109,782 |
| Interquartile 75% (IQ3) | $122,894 | $165,133 |
| Interquartile Range (IQR) | $52,420 | $55,351 |
| Standard Deviation (Sample) | $34,121 | $54,182 |
| Standard Deviation (Population) | $33,896 | $52,936 |
Demographics Similar to Lithuanians and Immigrants from Switzerland by Householder Income Ages 45 - 64 years
In terms of householder income ages 45 - 64 years, the demographic groups most similar to Lithuanians are Greek ($112,630, a difference of 0.13%), Afghan ($112,676, a difference of 0.17%), Immigrants from Malaysia ($112,796, a difference of 0.28%), Immigrants from South Africa ($112,886, a difference of 0.36%), and Immigrants from Austria ($113,140, a difference of 0.58%). Similarly, the demographic groups most similar to Immigrants from Switzerland are Latvian ($115,957, a difference of 0.020%), Maltese ($114,754, a difference of 1.0%), Immigrants from Pakistan ($114,434, a difference of 1.3%), Immigrants from Turkey ($114,407, a difference of 1.3%), and Cambodian ($114,342, a difference of 1.4%).
| Demographics | Rating | Rank | Householder Income Ages 45 - 64 years |
| Latvians | 100.0 /100 | #35 | Exceptional $115,957 |
| Immigrants | Switzerland | 100.0 /100 | #36 | Exceptional $115,934 |
| Maltese | 99.9 /100 | #37 | Exceptional $114,754 |
| Immigrants | Pakistan | 99.9 /100 | #38 | Exceptional $114,434 |
| Immigrants | Turkey | 99.9 /100 | #39 | Exceptional $114,407 |
| Cambodians | 99.9 /100 | #40 | Exceptional $114,342 |
| Immigrants | Lithuania | 99.9 /100 | #41 | Exceptional $114,336 |
| Estonians | 99.9 /100 | #42 | Exceptional $114,220 |
| Israelis | 99.9 /100 | #43 | Exceptional $114,186 |
| Bulgarians | 99.9 /100 | #44 | Exceptional $113,883 |
| Immigrants | France | 99.9 /100 | #45 | Exceptional $113,680 |
| Immigrants | Greece | 99.9 /100 | #46 | Exceptional $113,548 |
| Australians | 99.9 /100 | #47 | Exceptional $113,533 |
| Immigrants | Indonesia | 99.9 /100 | #48 | Exceptional $113,519 |
| Immigrants | Russia | 99.8 /100 | #49 | Exceptional $113,215 |
| Immigrants | Austria | 99.8 /100 | #50 | Exceptional $113,140 |
| Immigrants | South Africa | 99.8 /100 | #51 | Exceptional $112,886 |
| Immigrants | Malaysia | 99.8 /100 | #52 | Exceptional $112,796 |
| Afghans | 99.8 /100 | #53 | Exceptional $112,676 |
| Greeks | 99.8 /100 | #54 | Exceptional $112,630 |
| Lithuanians | 99.8 /100 | #55 | Exceptional $112,484 |