Liberian vs Paiute Child Poverty Under the Age of 16
COMPARE
Liberian
Paiute
Child Poverty Under the Age of 16
Child Poverty Under the Age of 16 Comparison
Liberians
Paiute
19.5%
CHILD POVERTY UNDER THE AGE OF 16
0.1/ 100
METRIC RATING
266th/ 347
METRIC RANK
22.4%
CHILD POVERTY UNDER THE AGE OF 16
0.0/ 100
METRIC RATING
323rd/ 347
METRIC RANK
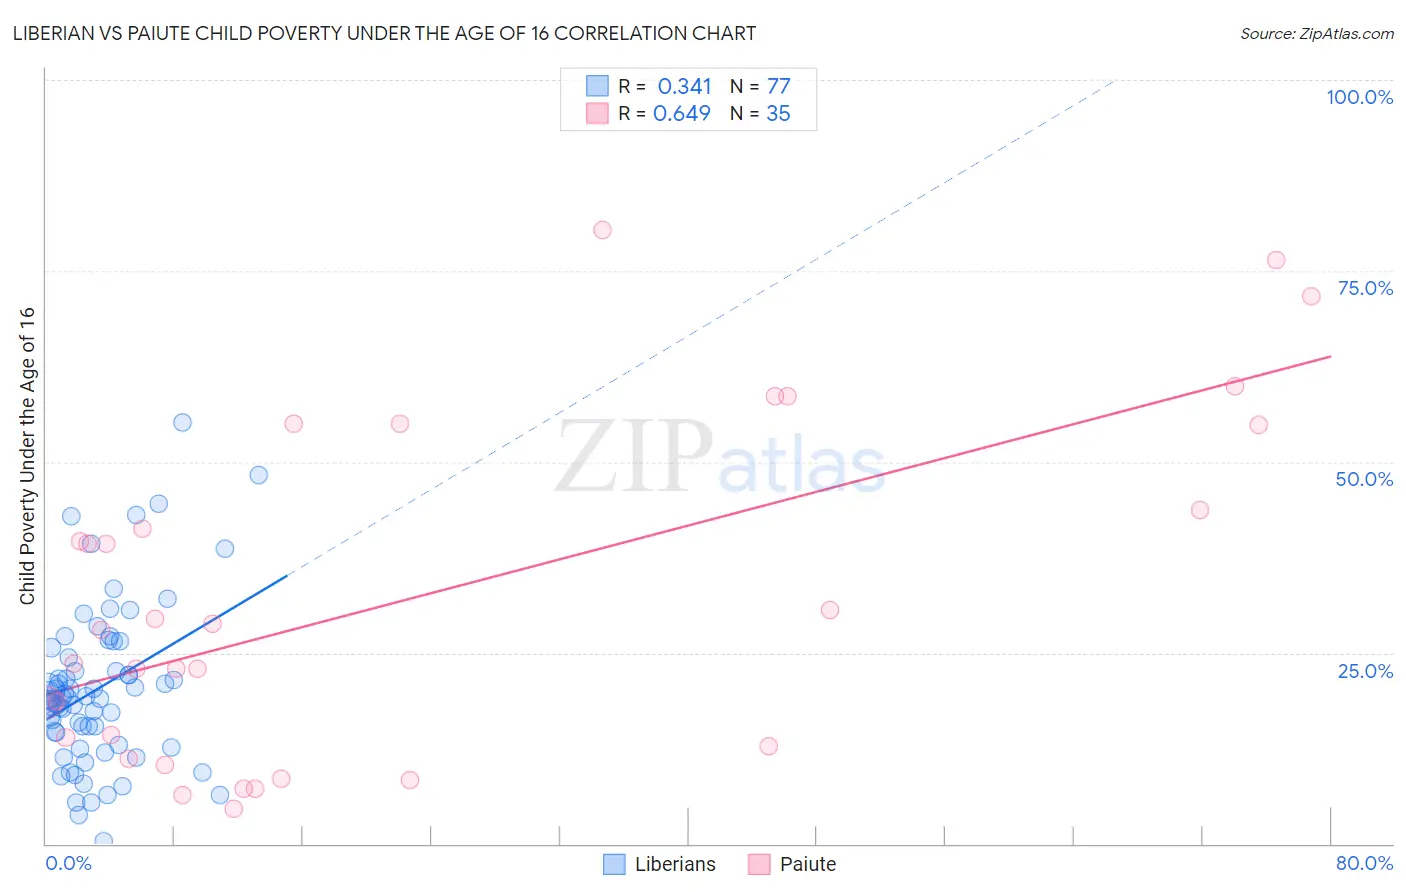
Liberian vs Paiute Child Poverty Under the Age of 16 Correlation Chart
The statistical analysis conducted on geographies consisting of 117,874,935 people shows a mild positive correlation between the proportion of Liberians and poverty level among children under the age of 16 in the United States with a correlation coefficient (R) of 0.341 and weighted average of 19.5%. Similarly, the statistical analysis conducted on geographies consisting of 58,234,702 people shows a significant positive correlation between the proportion of Paiute and poverty level among children under the age of 16 in the United States with a correlation coefficient (R) of 0.649 and weighted average of 22.4%, a difference of 15.1%.
Child Poverty Under the Age of 16 Correlation Summary
| Measurement | Liberian | Paiute |
| Minimum | 0.33% | 4.6% |
| Maximum | 55.1% | 80.4% |
| Range | 54.8% | 75.7% |
| Mean | 20.3% | 32.1% |
| Median | 19.1% | 28.0% |
| Interquartile 25% (IQ1) | 13.8% | 12.7% |
| Interquartile 75% (IQ3) | 25.0% | 54.8% |
| Interquartile Range (IQR) | 11.2% | 42.1% |
| Standard Deviation (Sample) | 10.5% | 22.0% |
| Standard Deviation (Population) | 10.4% | 21.7% |
Similar Demographics by Child Poverty Under the Age of 16
Demographics Similar to Liberians by Child Poverty Under the Age of 16
In terms of child poverty under the age of 16, the demographic groups most similar to Liberians are Chickasaw (19.5%, a difference of 0.10%), Immigrants from Ecuador (19.4%, a difference of 0.22%), Vietnamese (19.4%, a difference of 0.28%), Cherokee (19.5%, a difference of 0.29%), and Immigrants from Guyana (19.4%, a difference of 0.60%).
| Demographics | Rating | Rank | Child Poverty Under the Age of 16 |
| Mexican American Indians | 0.2 /100 | #259 | Tragic 19.3% |
| Guyanese | 0.2 /100 | #260 | Tragic 19.3% |
| Immigrants | Burma/Myanmar | 0.1 /100 | #261 | Tragic 19.4% |
| Immigrants | Guyana | 0.1 /100 | #262 | Tragic 19.4% |
| Vietnamese | 0.1 /100 | #263 | Tragic 19.4% |
| Immigrants | Ecuador | 0.1 /100 | #264 | Tragic 19.4% |
| Chickasaw | 0.1 /100 | #265 | Tragic 19.5% |
| Liberians | 0.1 /100 | #266 | Tragic 19.5% |
| Cherokee | 0.1 /100 | #267 | Tragic 19.5% |
| Jamaicans | 0.1 /100 | #268 | Tragic 19.7% |
| Immigrants | El Salvador | 0.1 /100 | #269 | Tragic 19.7% |
| Spanish American Indians | 0.1 /100 | #270 | Tragic 19.7% |
| Immigrants | Liberia | 0.1 /100 | #271 | Tragic 19.7% |
| Immigrants | Bangladesh | 0.1 /100 | #272 | Tragic 19.8% |
| Immigrants | Jamaica | 0.1 /100 | #273 | Tragic 19.8% |
Demographics Similar to Paiute by Child Poverty Under the Age of 16
In terms of child poverty under the age of 16, the demographic groups most similar to Paiute are Central American Indian (22.5%, a difference of 0.31%), Immigrants from Congo (22.5%, a difference of 0.45%), Honduran (22.2%, a difference of 1.0%), Kiowa (22.2%, a difference of 1.2%), and Immigrants from Honduras (22.7%, a difference of 1.3%).
| Demographics | Rating | Rank | Child Poverty Under the Age of 16 |
| Africans | 0.0 /100 | #316 | Tragic 21.7% |
| Immigrants | Dominica | 0.0 /100 | #317 | Tragic 21.9% |
| U.S. Virgin Islanders | 0.0 /100 | #318 | Tragic 22.0% |
| Yakama | 0.0 /100 | #319 | Tragic 22.1% |
| Cajuns | 0.0 /100 | #320 | Tragic 22.1% |
| Kiowa | 0.0 /100 | #321 | Tragic 22.2% |
| Hondurans | 0.0 /100 | #322 | Tragic 22.2% |
| Paiute | 0.0 /100 | #323 | Tragic 22.4% |
| Central American Indians | 0.0 /100 | #324 | Tragic 22.5% |
| Immigrants | Congo | 0.0 /100 | #325 | Tragic 22.5% |
| Immigrants | Honduras | 0.0 /100 | #326 | Tragic 22.7% |
| Menominee | 0.0 /100 | #327 | Tragic 23.0% |
| Colville | 0.0 /100 | #328 | Tragic 23.0% |
| Dominicans | 0.0 /100 | #329 | Tragic 23.8% |
| Natives/Alaskans | 0.0 /100 | #330 | Tragic 23.8% |