Liberian vs Canadian Householder Income Ages 25 - 44 years
COMPARE
Liberian
Canadian
Householder Income Ages 25 - 44 years
Householder Income Ages 25 - 44 years Comparison
Liberians
Canadians
$82,005
HOUSEHOLDER INCOME AGES 25 - 44 YEARS
0.1/ 100
METRIC RATING
290th/ 347
METRIC RANK
$97,625
HOUSEHOLDER INCOME AGES 25 - 44 YEARS
84.5/ 100
METRIC RATING
134th/ 347
METRIC RANK
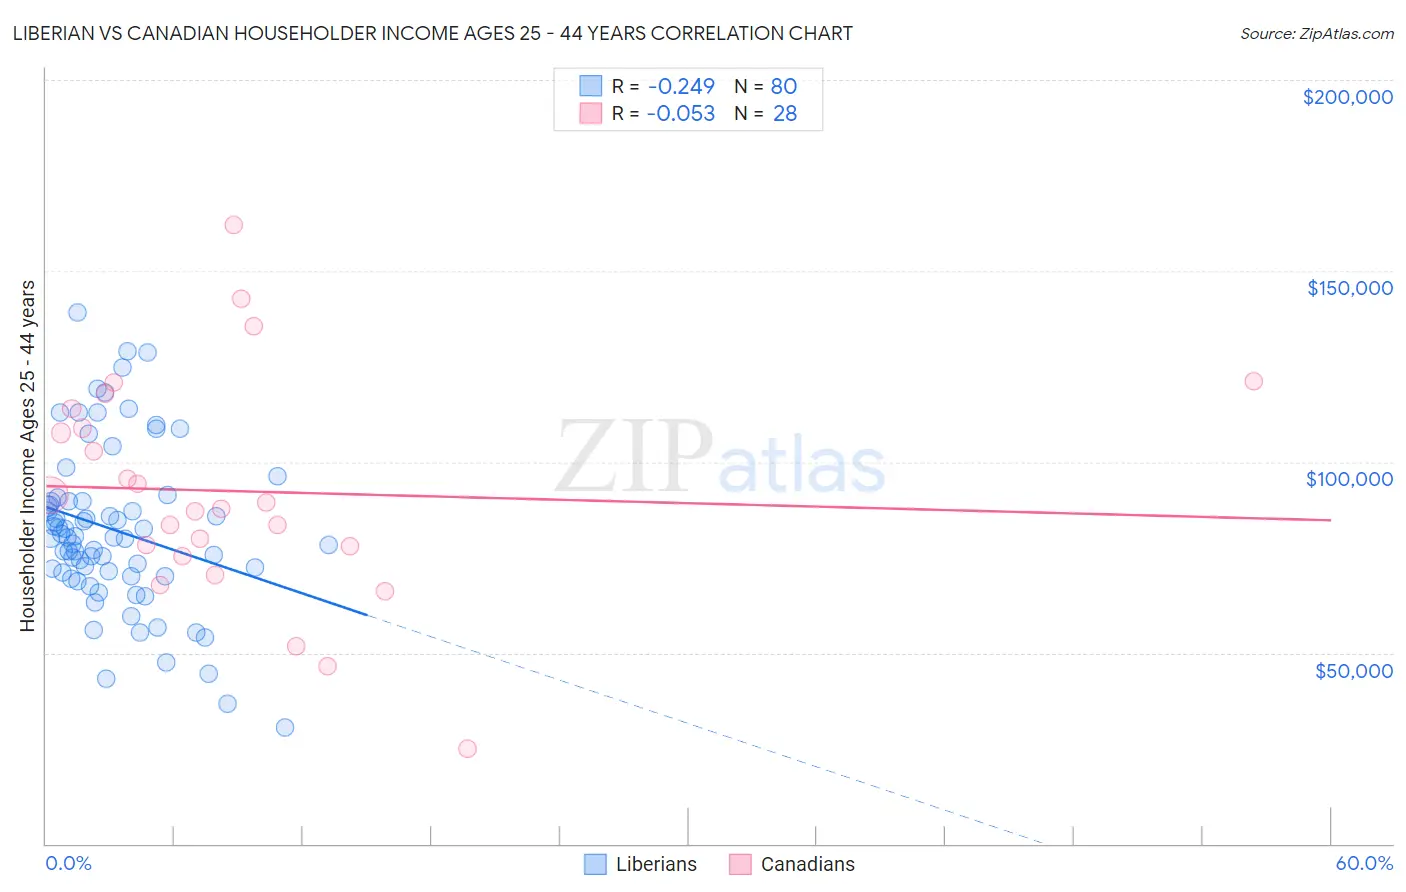
Liberian vs Canadian Householder Income Ages 25 - 44 years Correlation Chart
The statistical analysis conducted on geographies consisting of 117,996,712 people shows a weak negative correlation between the proportion of Liberians and household income with householder between the ages 25 and 44 in the United States with a correlation coefficient (R) of -0.249 and weighted average of $82,005. Similarly, the statistical analysis conducted on geographies consisting of 435,952,621 people shows a slight negative correlation between the proportion of Canadians and household income with householder between the ages 25 and 44 in the United States with a correlation coefficient (R) of -0.053 and weighted average of $97,625, a difference of 19.1%.
Householder Income Ages 25 - 44 years Correlation Summary
| Measurement | Liberian | Canadian |
| Minimum | $30,517 | $24,946 |
| Maximum | $139,167 | $162,133 |
| Range | $108,650 | $137,187 |
| Mean | $82,112 | $92,304 |
| Median | $80,107 | $88,643 |
| Interquartile 25% (IQ1) | $70,490 | $76,629 |
| Interquartile 75% (IQ3) | $89,678 | $111,424 |
| Interquartile Range (IQR) | $19,188 | $34,795 |
| Standard Deviation (Sample) | $21,404 | $29,698 |
| Standard Deviation (Population) | $21,270 | $29,162 |
Similar Demographics by Householder Income Ages 25 - 44 years
Demographics Similar to Liberians by Householder Income Ages 25 - 44 years
In terms of householder income ages 25 - 44 years, the demographic groups most similar to Liberians are Shoshone ($82,062, a difference of 0.070%), Comanche ($82,152, a difference of 0.18%), Ute ($82,166, a difference of 0.20%), Immigrants from Latin America ($82,166, a difference of 0.20%), and Immigrants from Somalia ($82,188, a difference of 0.22%).
| Demographics | Rating | Rank | Householder Income Ages 25 - 44 years |
| Guatemalans | 0.1 /100 | #283 | Tragic $82,331 |
| Immigrants | Middle Africa | 0.1 /100 | #284 | Tragic $82,254 |
| Immigrants | Somalia | 0.1 /100 | #285 | Tragic $82,188 |
| Ute | 0.1 /100 | #286 | Tragic $82,166 |
| Immigrants | Latin America | 0.1 /100 | #287 | Tragic $82,166 |
| Comanche | 0.1 /100 | #288 | Tragic $82,152 |
| Shoshone | 0.1 /100 | #289 | Tragic $82,062 |
| Liberians | 0.1 /100 | #290 | Tragic $82,005 |
| Potawatomi | 0.1 /100 | #291 | Tragic $81,774 |
| Yaqui | 0.1 /100 | #292 | Tragic $81,656 |
| Blackfeet | 0.1 /100 | #293 | Tragic $81,531 |
| Cubans | 0.1 /100 | #294 | Tragic $81,483 |
| Bangladeshis | 0.1 /100 | #295 | Tragic $81,363 |
| Immigrants | Dominica | 0.1 /100 | #296 | Tragic $81,351 |
| Immigrants | Guatemala | 0.1 /100 | #297 | Tragic $81,341 |
Demographics Similar to Canadians by Householder Income Ages 25 - 44 years
In terms of householder income ages 25 - 44 years, the demographic groups most similar to Canadians are Immigrants from Oceania ($97,623, a difference of 0.0%), Hungarian ($97,544, a difference of 0.080%), Tsimshian ($97,809, a difference of 0.19%), Immigrants from Zimbabwe ($97,880, a difference of 0.26%), and Lebanese ($97,339, a difference of 0.29%).
| Demographics | Rating | Rank | Householder Income Ages 25 - 44 years |
| Serbians | 88.9 /100 | #127 | Excellent $98,320 |
| Europeans | 88.9 /100 | #128 | Excellent $98,310 |
| Brazilians | 88.6 /100 | #129 | Excellent $98,267 |
| Immigrants | Kuwait | 87.8 /100 | #130 | Excellent $98,122 |
| Immigrants | Albania | 86.6 /100 | #131 | Excellent $97,929 |
| Immigrants | Zimbabwe | 86.3 /100 | #132 | Excellent $97,880 |
| Tsimshian | 85.8 /100 | #133 | Excellent $97,809 |
| Canadians | 84.5 /100 | #134 | Excellent $97,625 |
| Immigrants | Oceania | 84.5 /100 | #135 | Excellent $97,623 |
| Hungarians | 83.9 /100 | #136 | Excellent $97,544 |
| Lebanese | 82.3 /100 | #137 | Excellent $97,339 |
| Arabs | 82.3 /100 | #138 | Excellent $97,336 |
| Immigrants | Peru | 82.2 /100 | #139 | Excellent $97,329 |
| Immigrants | Morocco | 82.0 /100 | #140 | Excellent $97,305 |
| Luxembourgers | 81.5 /100 | #141 | Excellent $97,237 |