Immigrants from Southern Europe vs Albanian Median Family Income
COMPARE
Immigrants from Southern Europe
Albanian
Median Family Income
Median Family Income Comparison
Immigrants from Southern Europe
Albanians
$110,614
MEDIAN FAMILY INCOME
98.3/ 100
METRIC RATING
91st/ 347
METRIC RANK
$109,136
MEDIAN FAMILY INCOME
96.4/ 100
METRIC RATING
106th/ 347
METRIC RANK
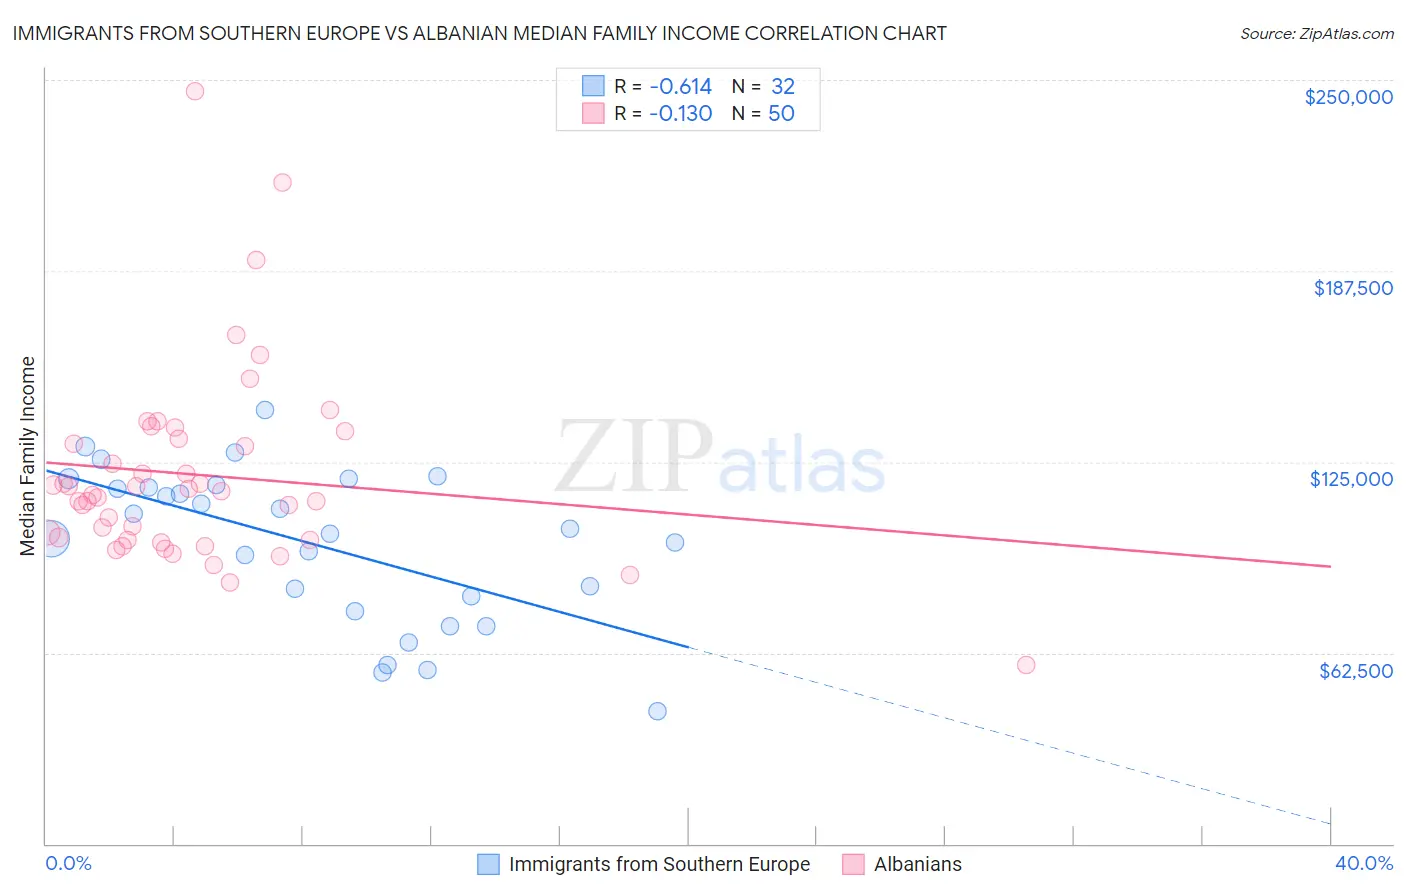
Immigrants from Southern Europe vs Albanian Median Family Income Correlation Chart
The statistical analysis conducted on geographies consisting of 402,509,296 people shows a significant negative correlation between the proportion of Immigrants from Southern Europe and median family income in the United States with a correlation coefficient (R) of -0.614 and weighted average of $110,614. Similarly, the statistical analysis conducted on geographies consisting of 193,155,793 people shows a poor negative correlation between the proportion of Albanians and median family income in the United States with a correlation coefficient (R) of -0.130 and weighted average of $109,136, a difference of 1.3%.
Median Family Income Correlation Summary
| Measurement | Immigrants from Southern Europe | Albanian |
| Minimum | $43,571 | $58,625 |
| Maximum | $141,836 | $246,215 |
| Range | $98,265 | $187,590 |
| Mean | $97,967 | $120,773 |
| Median | $102,217 | $114,864 |
| Interquartile 25% (IQ1) | $78,639 | $99,531 |
| Interquartile 75% (IQ3) | $117,023 | $132,647 |
| Interquartile Range (IQR) | $38,384 | $33,116 |
| Standard Deviation (Sample) | $25,189 | $32,208 |
| Standard Deviation (Population) | $24,793 | $31,885 |
Demographics Similar to Immigrants from Southern Europe and Albanians by Median Family Income
In terms of median family income, the demographic groups most similar to Immigrants from Southern Europe are Northern European ($110,635, a difference of 0.020%), Immigrants from Argentina ($110,873, a difference of 0.23%), Immigrants from Lebanon ($110,159, a difference of 0.41%), Immigrants from Kazakhstan ($110,137, a difference of 0.43%), and Korean ($110,103, a difference of 0.46%). Similarly, the demographic groups most similar to Albanians are Immigrants from North Macedonia ($109,136, a difference of 0.0%), Syrian ($109,299, a difference of 0.15%), Palestinian ($109,413, a difference of 0.25%), Immigrants from Brazil ($109,418, a difference of 0.26%), and Immigrants from Zimbabwe ($108,830, a difference of 0.28%).
| Demographics | Rating | Rank | Median Family Income |
| Romanians | 98.8 /100 | #88 | Exceptional $111,243 |
| Immigrants | Argentina | 98.5 /100 | #89 | Exceptional $110,873 |
| Northern Europeans | 98.3 /100 | #90 | Exceptional $110,635 |
| Immigrants | Southern Europe | 98.3 /100 | #91 | Exceptional $110,614 |
| Immigrants | Lebanon | 97.9 /100 | #92 | Exceptional $110,159 |
| Immigrants | Kazakhstan | 97.8 /100 | #93 | Exceptional $110,137 |
| Koreans | 97.8 /100 | #94 | Exceptional $110,103 |
| Zimbabweans | 97.7 /100 | #95 | Exceptional $110,011 |
| Immigrants | Moldova | 97.7 /100 | #96 | Exceptional $109,975 |
| Jordanians | 97.5 /100 | #97 | Exceptional $109,865 |
| Immigrants | Kuwait | 97.4 /100 | #98 | Exceptional $109,731 |
| Armenians | 97.3 /100 | #99 | Exceptional $109,692 |
| Macedonians | 97.3 /100 | #100 | Exceptional $109,668 |
| Immigrants | Ukraine | 97.2 /100 | #101 | Exceptional $109,645 |
| Assyrians/Chaldeans/Syriacs | 97.2 /100 | #102 | Exceptional $109,622 |
| Immigrants | Brazil | 96.9 /100 | #103 | Exceptional $109,418 |
| Palestinians | 96.9 /100 | #104 | Exceptional $109,413 |
| Syrians | 96.7 /100 | #105 | Exceptional $109,299 |
| Albanians | 96.4 /100 | #106 | Exceptional $109,136 |
| Immigrants | North Macedonia | 96.4 /100 | #107 | Exceptional $109,136 |
| Immigrants | Zimbabwe | 95.9 /100 | #108 | Exceptional $108,830 |