Lebanese vs Immigrants from China Median Family Income
COMPARE
Lebanese
Immigrants from China
Median Family Income
Median Family Income Comparison
Lebanese
Immigrants from China
$107,086
MEDIAN FAMILY INCOME
90.5/ 100
METRIC RATING
127th/ 347
METRIC RANK
$125,540
MEDIAN FAMILY INCOME
100.0/ 100
METRIC RATING
16th/ 347
METRIC RANK
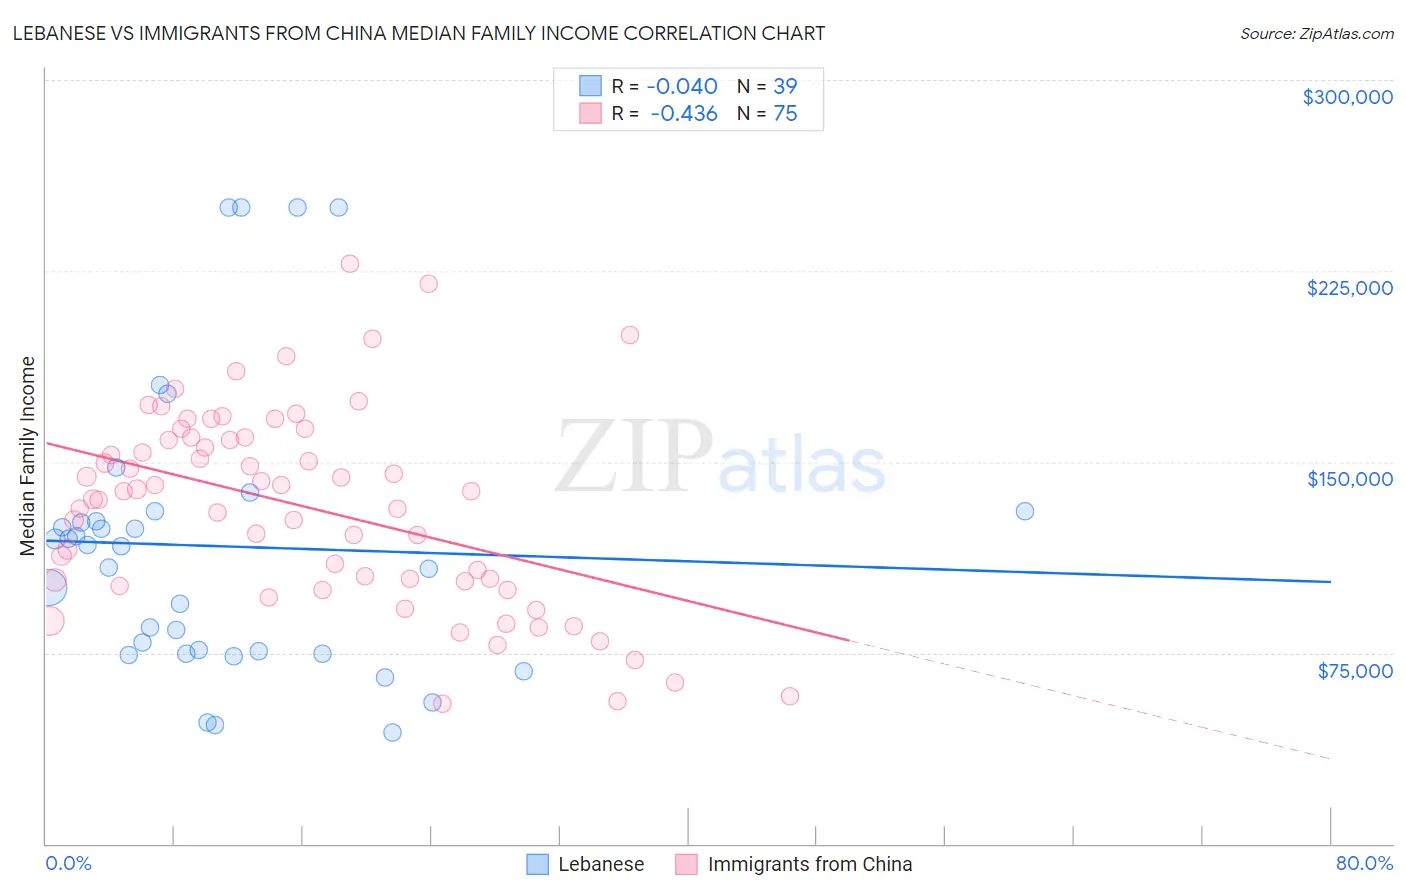
Lebanese vs Immigrants from China Median Family Income Correlation Chart
The statistical analysis conducted on geographies consisting of 401,188,092 people shows no correlation between the proportion of Lebanese and median family income in the United States with a correlation coefficient (R) of -0.040 and weighted average of $107,086. Similarly, the statistical analysis conducted on geographies consisting of 456,354,343 people shows a moderate negative correlation between the proportion of Immigrants from China and median family income in the United States with a correlation coefficient (R) of -0.436 and weighted average of $125,540, a difference of 17.2%.
Median Family Income Correlation Summary
| Measurement | Lebanese | Immigrants from China |
| Minimum | $43,594 | $55,016 |
| Maximum | $250,001 | $227,676 |
| Range | $206,407 | $172,660 |
| Mean | $116,877 | $132,303 |
| Median | $116,743 | $138,661 |
| Interquartile 25% (IQ1) | $74,798 | $103,301 |
| Interquartile 75% (IQ3) | $130,372 | $159,432 |
| Interquartile Range (IQR) | $55,574 | $56,131 |
| Standard Deviation (Sample) | $56,099 | $38,553 |
| Standard Deviation (Population) | $55,375 | $38,295 |
Similar Demographics by Median Family Income
Demographics Similar to Lebanese by Median Family Income
In terms of median family income, the demographic groups most similar to Lebanese are Serbian ($107,157, a difference of 0.070%), Immigrants from Ethiopia ($106,969, a difference of 0.11%), Arab ($106,952, a difference of 0.12%), Brazilian ($106,942, a difference of 0.13%), and Taiwanese ($107,295, a difference of 0.19%).
| Demographics | Rating | Rank | Median Family Income |
| Immigrants | Northern Africa | 94.3 /100 | #120 | Exceptional $108,161 |
| Europeans | 94.1 /100 | #121 | Exceptional $108,099 |
| Immigrants | Jordan | 92.9 /100 | #122 | Exceptional $107,715 |
| Carpatho Rusyns | 92.2 /100 | #123 | Exceptional $107,502 |
| Pakistanis | 91.7 /100 | #124 | Exceptional $107,390 |
| Taiwanese | 91.4 /100 | #125 | Exceptional $107,295 |
| Serbians | 90.8 /100 | #126 | Exceptional $107,157 |
| Lebanese | 90.5 /100 | #127 | Exceptional $107,086 |
| Immigrants | Ethiopia | 90.0 /100 | #128 | Excellent $106,969 |
| Arabs | 89.9 /100 | #129 | Excellent $106,952 |
| Brazilians | 89.8 /100 | #130 | Excellent $106,942 |
| Canadians | 88.1 /100 | #131 | Excellent $106,597 |
| Immigrants | Fiji | 87.8 /100 | #132 | Excellent $106,544 |
| Ugandans | 87.8 /100 | #133 | Excellent $106,541 |
| Immigrants | Oceania | 87.3 /100 | #134 | Excellent $106,453 |
Demographics Similar to Immigrants from China by Median Family Income
In terms of median family income, the demographic groups most similar to Immigrants from China are Eastern European ($125,546, a difference of 0.0%), Indian (Asian) ($125,312, a difference of 0.18%), Immigrants from Eastern Asia ($125,150, a difference of 0.31%), Immigrants from South Central Asia ($125,956, a difference of 0.33%), and Immigrants from Australia ($126,620, a difference of 0.86%).
| Demographics | Rating | Rank | Median Family Income |
| Okinawans | 100.0 /100 | #9 | Exceptional $129,979 |
| Immigrants | Ireland | 100.0 /100 | #10 | Exceptional $127,584 |
| Immigrants | Israel | 100.0 /100 | #11 | Exceptional $127,430 |
| Cypriots | 100.0 /100 | #12 | Exceptional $127,064 |
| Immigrants | Australia | 100.0 /100 | #13 | Exceptional $126,620 |
| Immigrants | South Central Asia | 100.0 /100 | #14 | Exceptional $125,956 |
| Eastern Europeans | 100.0 /100 | #15 | Exceptional $125,546 |
| Immigrants | China | 100.0 /100 | #16 | Exceptional $125,540 |
| Indians (Asian) | 100.0 /100 | #17 | Exceptional $125,312 |
| Immigrants | Eastern Asia | 100.0 /100 | #18 | Exceptional $125,150 |
| Immigrants | Belgium | 100.0 /100 | #19 | Exceptional $123,831 |
| Burmese | 100.0 /100 | #20 | Exceptional $123,369 |
| Immigrants | Korea | 100.0 /100 | #21 | Exceptional $122,800 |
| Immigrants | Sweden | 100.0 /100 | #22 | Exceptional $122,765 |
| Immigrants | Japan | 100.0 /100 | #23 | Exceptional $122,764 |