Latvian vs Chickasaw Householder Income Ages 25 - 44 years
COMPARE
Latvian
Chickasaw
Householder Income Ages 25 - 44 years
Householder Income Ages 25 - 44 years Comparison
Latvians
Chickasaw
$108,926
HOUSEHOLDER INCOME AGES 25 - 44 YEARS
100.0/ 100
METRIC RATING
36th/ 347
METRIC RANK
$77,929
HOUSEHOLDER INCOME AGES 25 - 44 YEARS
0.0/ 100
METRIC RATING
322nd/ 347
METRIC RANK
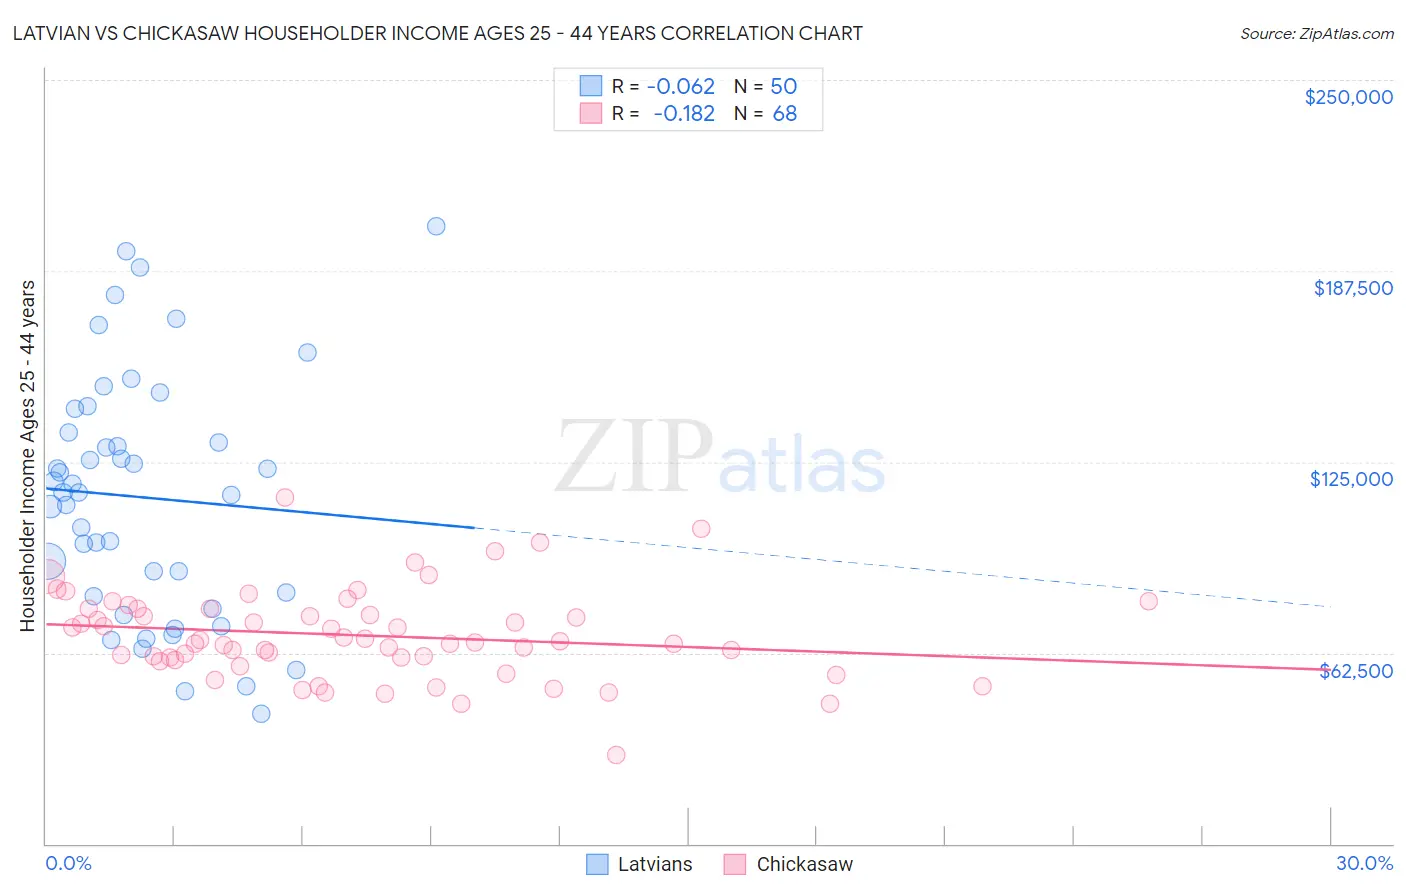
Latvian vs Chickasaw Householder Income Ages 25 - 44 years Correlation Chart
The statistical analysis conducted on geographies consisting of 220,250,267 people shows a slight negative correlation between the proportion of Latvians and household income with householder between the ages 25 and 44 in the United States with a correlation coefficient (R) of -0.062 and weighted average of $108,926. Similarly, the statistical analysis conducted on geographies consisting of 147,542,278 people shows a poor negative correlation between the proportion of Chickasaw and household income with householder between the ages 25 and 44 in the United States with a correlation coefficient (R) of -0.182 and weighted average of $77,929, a difference of 39.8%.
Householder Income Ages 25 - 44 years Correlation Summary
| Measurement | Latvian | Chickasaw |
| Minimum | $42,679 | $29,071 |
| Maximum | $202,188 | $113,361 |
| Range | $159,509 | $84,290 |
| Mean | $113,340 | $68,238 |
| Median | $114,915 | $66,121 |
| Interquartile 25% (IQ1) | $80,877 | $60,623 |
| Interquartile 75% (IQ3) | $134,488 | $76,882 |
| Interquartile Range (IQR) | $53,611 | $16,259 |
| Standard Deviation (Sample) | $39,584 | $14,676 |
| Standard Deviation (Population) | $39,186 | $14,567 |
Similar Demographics by Householder Income Ages 25 - 44 years
Demographics Similar to Latvians by Householder Income Ages 25 - 44 years
In terms of householder income ages 25 - 44 years, the demographic groups most similar to Latvians are Immigrants from Russia ($108,751, a difference of 0.16%), Immigrants from Switzerland ($109,185, a difference of 0.24%), Bolivian ($109,372, a difference of 0.41%), Soviet Union ($108,457, a difference of 0.43%), and Bhutanese ($109,520, a difference of 0.55%).
| Demographics | Rating | Rank | Householder Income Ages 25 - 44 years |
| Turks | 100.0 /100 | #29 | Exceptional $110,318 |
| Immigrants | Greece | 100.0 /100 | #30 | Exceptional $110,103 |
| Maltese | 100.0 /100 | #31 | Exceptional $110,064 |
| Immigrants | Sri Lanka | 100.0 /100 | #32 | Exceptional $109,741 |
| Bhutanese | 100.0 /100 | #33 | Exceptional $109,520 |
| Bolivians | 100.0 /100 | #34 | Exceptional $109,372 |
| Immigrants | Switzerland | 100.0 /100 | #35 | Exceptional $109,185 |
| Latvians | 100.0 /100 | #36 | Exceptional $108,926 |
| Immigrants | Russia | 100.0 /100 | #37 | Exceptional $108,751 |
| Soviet Union | 100.0 /100 | #38 | Exceptional $108,457 |
| Immigrants | France | 99.9 /100 | #39 | Exceptional $108,257 |
| Immigrants | Lithuania | 99.9 /100 | #40 | Exceptional $108,149 |
| Immigrants | Bolivia | 99.9 /100 | #41 | Exceptional $108,128 |
| Australians | 99.9 /100 | #42 | Exceptional $107,912 |
| Immigrants | Malaysia | 99.9 /100 | #43 | Exceptional $107,650 |
Demographics Similar to Chickasaw by Householder Income Ages 25 - 44 years
In terms of householder income ages 25 - 44 years, the demographic groups most similar to Chickasaw are Immigrants from Zaire ($78,045, a difference of 0.15%), Choctaw ($78,168, a difference of 0.31%), Honduran ($78,540, a difference of 0.78%), Immigrants from Honduras ($77,328, a difference of 0.78%), and Dutch West Indian ($77,260, a difference of 0.87%).
| Demographics | Rating | Rank | Householder Income Ages 25 - 44 years |
| Ottawa | 0.0 /100 | #315 | Tragic $79,012 |
| Africans | 0.0 /100 | #316 | Tragic $78,986 |
| U.S. Virgin Islanders | 0.0 /100 | #317 | Tragic $78,911 |
| Immigrants | Mexico | 0.0 /100 | #318 | Tragic $78,809 |
| Hondurans | 0.0 /100 | #319 | Tragic $78,540 |
| Choctaw | 0.0 /100 | #320 | Tragic $78,168 |
| Immigrants | Zaire | 0.0 /100 | #321 | Tragic $78,045 |
| Chickasaw | 0.0 /100 | #322 | Tragic $77,929 |
| Immigrants | Honduras | 0.0 /100 | #323 | Tragic $77,328 |
| Dutch West Indians | 0.0 /100 | #324 | Tragic $77,260 |
| Sioux | 0.0 /100 | #325 | Tragic $77,089 |
| Houma | 0.0 /100 | #326 | Tragic $77,044 |
| Immigrants | Bahamas | 0.0 /100 | #327 | Tragic $76,910 |
| Immigrants | Cuba | 0.0 /100 | #328 | Tragic $76,701 |
| Seminole | 0.0 /100 | #329 | Tragic $76,584 |