Korean vs Immigrants from Uganda Per Capita Income
COMPARE
Korean
Immigrants from Uganda
Per Capita Income
Per Capita Income Comparison
Koreans
Immigrants from Uganda
$44,522
PER CAPITA INCOME
72.5/ 100
METRIC RATING
149th/ 347
METRIC RANK
$45,043
PER CAPITA INCOME
82.5/ 100
METRIC RATING
143rd/ 347
METRIC RANK
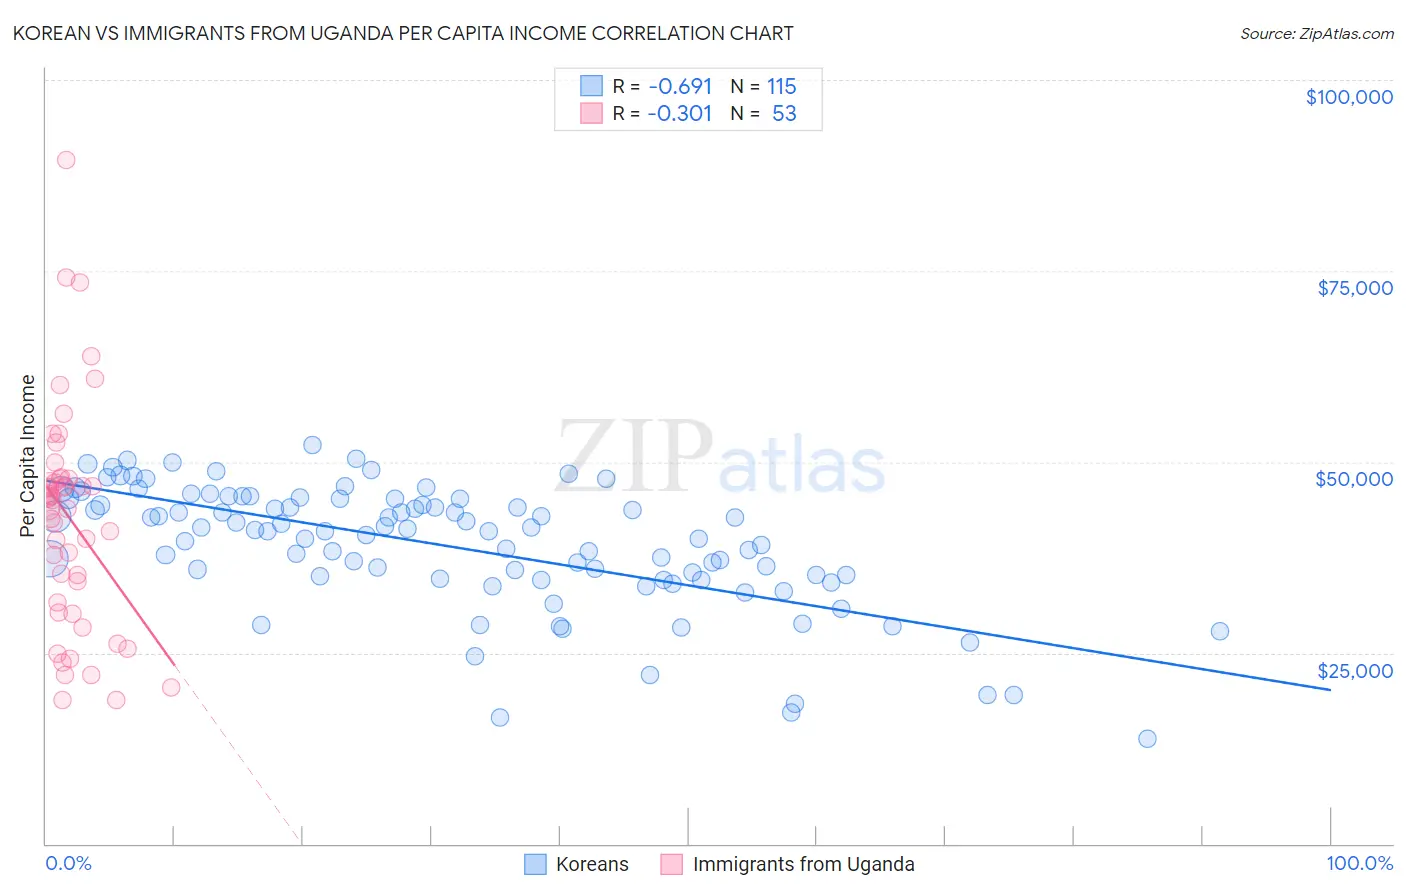
Korean vs Immigrants from Uganda Per Capita Income Correlation Chart
The statistical analysis conducted on geographies consisting of 510,996,517 people shows a significant negative correlation between the proportion of Koreans and per capita income in the United States with a correlation coefficient (R) of -0.691 and weighted average of $44,522. Similarly, the statistical analysis conducted on geographies consisting of 125,982,219 people shows a mild negative correlation between the proportion of Immigrants from Uganda and per capita income in the United States with a correlation coefficient (R) of -0.301 and weighted average of $45,043, a difference of 1.2%.
Per Capita Income Correlation Summary
| Measurement | Korean | Immigrants from Uganda |
| Minimum | $13,802 | $18,741 |
| Maximum | $52,147 | $89,561 |
| Range | $38,345 | $70,820 |
| Mean | $38,981 | $42,540 |
| Median | $40,908 | $45,016 |
| Interquartile 25% (IQ1) | $34,687 | $30,934 |
| Interquartile 75% (IQ3) | $45,181 | $47,740 |
| Interquartile Range (IQR) | $10,494 | $16,806 |
| Standard Deviation (Sample) | $8,123 | $14,536 |
| Standard Deviation (Population) | $8,088 | $14,398 |
Demographics Similar to Koreans and Immigrants from Uganda by Per Capita Income
In terms of per capita income, the demographic groups most similar to Koreans are Immigrants from Eritrea ($44,509, a difference of 0.030%), Immigrants from Armenia ($44,552, a difference of 0.070%), Norwegian ($44,480, a difference of 0.10%), Peruvian ($44,479, a difference of 0.10%), and Czech ($44,595, a difference of 0.16%). Similarly, the demographic groups most similar to Immigrants from Uganda are Slavic ($45,049, a difference of 0.010%), Ugandan ($45,047, a difference of 0.010%), Immigrants from Jordan ($45,066, a difference of 0.050%), Basque ($45,086, a difference of 0.10%), and Icelander ($44,987, a difference of 0.12%).
| Demographics | Rating | Rank | Per Capita Income |
| Immigrants | Oceania | 85.2 /100 | #136 | Excellent $45,220 |
| Immigrants | Syria | 85.2 /100 | #137 | Excellent $45,218 |
| Assyrians/Chaldeans/Syriacs | 84.8 /100 | #138 | Excellent $45,195 |
| Basques | 83.2 /100 | #139 | Excellent $45,086 |
| Immigrants | Jordan | 82.9 /100 | #140 | Excellent $45,066 |
| Slavs | 82.6 /100 | #141 | Excellent $45,049 |
| Ugandans | 82.6 /100 | #142 | Excellent $45,047 |
| Immigrants | Uganda | 82.5 /100 | #143 | Excellent $45,043 |
| Icelanders | 81.6 /100 | #144 | Excellent $44,987 |
| Immigrants | Afghanistan | 78.0 /100 | #145 | Good $44,790 |
| Irish | 75.8 /100 | #146 | Good $44,679 |
| Czechs | 74.1 /100 | #147 | Good $44,595 |
| Immigrants | Armenia | 73.1 /100 | #148 | Good $44,552 |
| Koreans | 72.5 /100 | #149 | Good $44,522 |
| Immigrants | Eritrea | 72.1 /100 | #150 | Good $44,509 |
| Norwegians | 71.5 /100 | #151 | Good $44,480 |
| Peruvians | 71.5 /100 | #152 | Good $44,479 |
| Scottish | 70.6 /100 | #153 | Good $44,440 |
| Portuguese | 68.7 /100 | #154 | Good $44,362 |
| Uruguayans | 67.6 /100 | #155 | Good $44,318 |
| Slovaks | 65.4 /100 | #156 | Good $44,229 |