Palestinian vs Immigrants from Belize Householder Income Ages 45 - 64 years
COMPARE
Palestinian
Immigrants from Belize
Householder Income Ages 45 - 64 years
Householder Income Ages 45 - 64 years Comparison
Palestinians
Immigrants from Belize
$107,721
HOUSEHOLDER INCOME AGES 45 - 64 YEARS
97.6/ 100
METRIC RATING
99th/ 347
METRIC RANK
$87,229
HOUSEHOLDER INCOME AGES 45 - 64 YEARS
0.1/ 100
METRIC RATING
275th/ 347
METRIC RANK
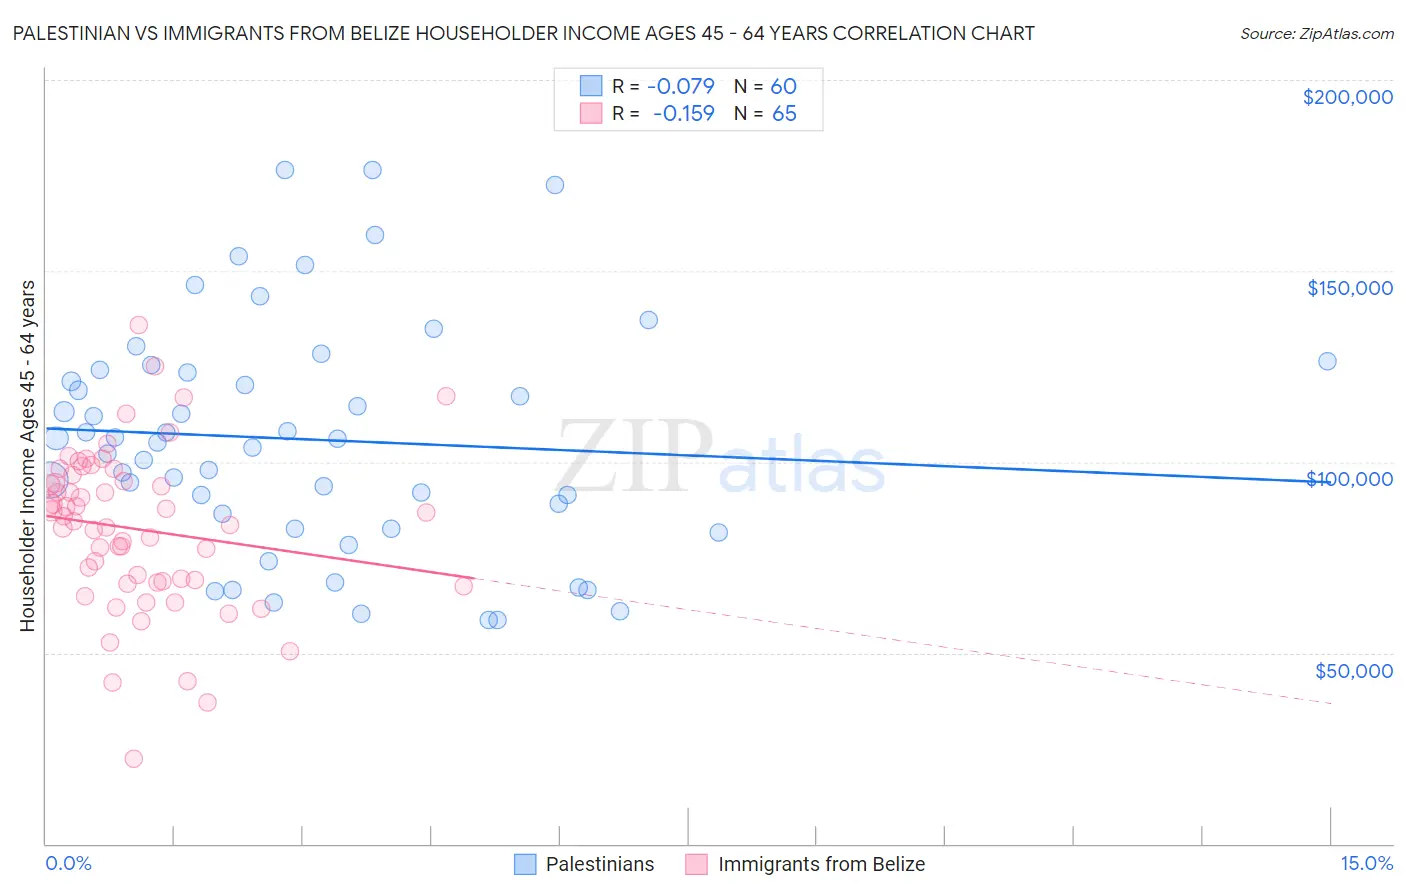
Palestinian vs Immigrants from Belize Householder Income Ages 45 - 64 years Correlation Chart
The statistical analysis conducted on geographies consisting of 216,304,002 people shows a slight negative correlation between the proportion of Palestinians and household income with householder between the ages 45 and 64 in the United States with a correlation coefficient (R) of -0.079 and weighted average of $107,721. Similarly, the statistical analysis conducted on geographies consisting of 130,242,241 people shows a poor negative correlation between the proportion of Immigrants from Belize and household income with householder between the ages 45 and 64 in the United States with a correlation coefficient (R) of -0.159 and weighted average of $87,229, a difference of 23.5%.
Householder Income Ages 45 - 64 years Correlation Summary
| Measurement | Palestinian | Immigrants from Belize |
| Minimum | $58,671 | $22,213 |
| Maximum | $176,545 | $135,848 |
| Range | $117,874 | $113,635 |
| Mean | $105,880 | $82,353 |
| Median | $105,547 | $84,313 |
| Interquartile 25% (IQ1) | $84,446 | $68,610 |
| Interquartile 75% (IQ3) | $123,759 | $95,695 |
| Interquartile Range (IQR) | $39,313 | $27,084 |
| Standard Deviation (Sample) | $30,088 | $20,996 |
| Standard Deviation (Population) | $29,836 | $20,834 |
Similar Demographics by Householder Income Ages 45 - 64 years
Demographics Similar to Palestinians by Householder Income Ages 45 - 64 years
In terms of householder income ages 45 - 64 years, the demographic groups most similar to Palestinians are Immigrants from Southern Europe ($107,775, a difference of 0.050%), Northern European ($107,870, a difference of 0.14%), Immigrants from Serbia ($107,569, a difference of 0.14%), Immigrants from Kazakhstan ($107,378, a difference of 0.32%), and Immigrants from Moldova ($107,357, a difference of 0.34%).
| Demographics | Rating | Rank | Householder Income Ages 45 - 64 years |
| Croatians | 98.3 /100 | #92 | Exceptional $108,383 |
| Immigrants | Croatia | 98.2 /100 | #93 | Exceptional $108,304 |
| Sri Lankans | 98.2 /100 | #94 | Exceptional $108,270 |
| Immigrants | Hungary | 98.2 /100 | #95 | Exceptional $108,267 |
| Immigrants | Argentina | 98.2 /100 | #96 | Exceptional $108,264 |
| Northern Europeans | 97.8 /100 | #97 | Exceptional $107,870 |
| Immigrants | Southern Europe | 97.7 /100 | #98 | Exceptional $107,775 |
| Palestinians | 97.6 /100 | #99 | Exceptional $107,721 |
| Immigrants | Serbia | 97.4 /100 | #100 | Exceptional $107,569 |
| Immigrants | Kazakhstan | 97.2 /100 | #101 | Exceptional $107,378 |
| Immigrants | Moldova | 97.1 /100 | #102 | Exceptional $107,357 |
| Syrians | 96.9 /100 | #103 | Exceptional $107,207 |
| Immigrants | Ukraine | 96.7 /100 | #104 | Exceptional $107,079 |
| Macedonians | 96.7 /100 | #105 | Exceptional $107,074 |
| Armenians | 96.6 /100 | #106 | Exceptional $107,002 |
Demographics Similar to Immigrants from Belize by Householder Income Ages 45 - 64 years
In terms of householder income ages 45 - 64 years, the demographic groups most similar to Immigrants from Belize are Immigrants from Latin America ($87,219, a difference of 0.010%), Iroquois ($87,255, a difference of 0.030%), Cree ($87,185, a difference of 0.050%), Immigrants from Jamaica ($87,035, a difference of 0.22%), and Yakama ($86,992, a difference of 0.27%).
| Demographics | Rating | Rank | Householder Income Ages 45 - 64 years |
| Immigrants | Micronesia | 0.2 /100 | #268 | Tragic $87,864 |
| Spanish Americans | 0.2 /100 | #269 | Tragic $87,836 |
| Immigrants | Liberia | 0.2 /100 | #270 | Tragic $87,739 |
| Guatemalans | 0.2 /100 | #271 | Tragic $87,705 |
| Cape Verdeans | 0.2 /100 | #272 | Tragic $87,580 |
| Spanish American Indians | 0.2 /100 | #273 | Tragic $87,561 |
| Iroquois | 0.1 /100 | #274 | Tragic $87,255 |
| Immigrants | Belize | 0.1 /100 | #275 | Tragic $87,229 |
| Immigrants | Latin America | 0.1 /100 | #276 | Tragic $87,219 |
| Cree | 0.1 /100 | #277 | Tragic $87,185 |
| Immigrants | Jamaica | 0.1 /100 | #278 | Tragic $87,035 |
| Yakama | 0.1 /100 | #279 | Tragic $86,992 |
| Immigrants | Somalia | 0.1 /100 | #280 | Tragic $86,987 |
| Yaqui | 0.1 /100 | #281 | Tragic $86,914 |
| Senegalese | 0.1 /100 | #282 | Tragic $86,897 |