Korean vs Immigrants from Belize In Labor Force | Age 30-34
COMPARE
Korean
Immigrants from Belize
In Labor Force | Age 30-34
In Labor Force | Age 30-34 Comparison
Koreans
Immigrants from Belize
84.5%
IN LABOR FORCE | AGE 30-34
23.2/ 100
METRIC RATING
195th/ 347
METRIC RANK
83.2%
IN LABOR FORCE | AGE 30-34
0.0/ 100
METRIC RATING
284th/ 347
METRIC RANK
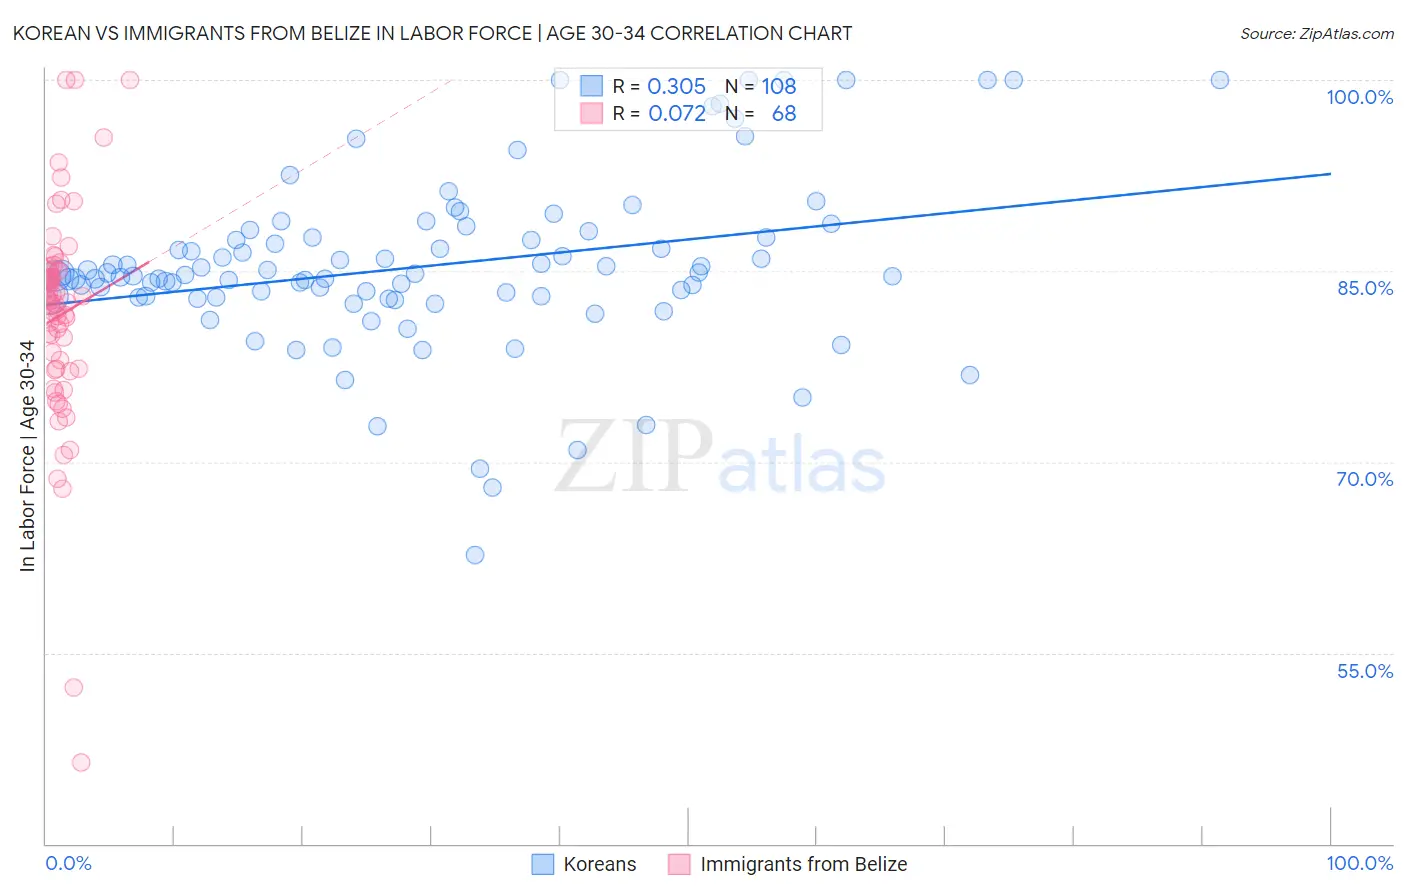
Korean vs Immigrants from Belize In Labor Force | Age 30-34 Correlation Chart
The statistical analysis conducted on geographies consisting of 510,404,908 people shows a mild positive correlation between the proportion of Koreans and labor force participation rate among population between the ages 30 and 34 in the United States with a correlation coefficient (R) of 0.305 and weighted average of 84.5%. Similarly, the statistical analysis conducted on geographies consisting of 130,310,300 people shows a slight positive correlation between the proportion of Immigrants from Belize and labor force participation rate among population between the ages 30 and 34 in the United States with a correlation coefficient (R) of 0.072 and weighted average of 83.2%, a difference of 1.6%.
In Labor Force | Age 30-34 Correlation Summary
| Measurement | Korean | Immigrants from Belize |
| Minimum | 62.6% | 46.4% |
| Maximum | 100.0% | 100.0% |
| Range | 37.4% | 53.6% |
| Mean | 85.4% | 81.5% |
| Median | 84.7% | 82.6% |
| Interquartile 25% (IQ1) | 83.0% | 77.3% |
| Interquartile 75% (IQ3) | 87.6% | 84.9% |
| Interquartile Range (IQR) | 4.7% | 7.6% |
| Standard Deviation (Sample) | 6.7% | 8.8% |
| Standard Deviation (Population) | 6.7% | 8.7% |
Similar Demographics by In Labor Force | Age 30-34
Demographics Similar to Koreans by In Labor Force | Age 30-34
In terms of in labor force | age 30-34, the demographic groups most similar to Koreans are Immigrants from Afghanistan (84.5%, a difference of 0.0%), British (84.5%, a difference of 0.0%), Scandinavian (84.5%, a difference of 0.010%), Immigrants from Costa Rica (84.5%, a difference of 0.010%), and Immigrants from Syria (84.5%, a difference of 0.010%).
| Demographics | Rating | Rank | In Labor Force | Age 30-34 |
| Taiwanese | 29.4 /100 | #188 | Fair 84.6% |
| Nigerians | 28.9 /100 | #189 | Fair 84.5% |
| Immigrants | Zaire | 25.8 /100 | #190 | Fair 84.5% |
| Hungarians | 24.8 /100 | #191 | Fair 84.5% |
| Scandinavians | 24.7 /100 | #192 | Fair 84.5% |
| Immigrants | Costa Rica | 23.9 /100 | #193 | Fair 84.5% |
| Immigrants | Afghanistan | 23.5 /100 | #194 | Fair 84.5% |
| Koreans | 23.2 /100 | #195 | Fair 84.5% |
| British | 22.9 /100 | #196 | Fair 84.5% |
| Immigrants | Syria | 21.9 /100 | #197 | Fair 84.5% |
| Dutch | 20.2 /100 | #198 | Fair 84.5% |
| Immigrants | Thailand | 19.1 /100 | #199 | Poor 84.5% |
| Sub-Saharan Africans | 19.0 /100 | #200 | Poor 84.5% |
| Trinidadians and Tobagonians | 18.2 /100 | #201 | Poor 84.5% |
| Immigrants | West Indies | 18.1 /100 | #202 | Poor 84.5% |
Demographics Similar to Immigrants from Belize by In Labor Force | Age 30-34
In terms of in labor force | age 30-34, the demographic groups most similar to Immigrants from Belize are Cree (83.2%, a difference of 0.0%), Assyrian/Chaldean/Syriac (83.2%, a difference of 0.050%), Immigrants from Latin America (83.1%, a difference of 0.060%), Mexican American Indian (83.2%, a difference of 0.070%), and Samoan (83.3%, a difference of 0.10%).
| Demographics | Rating | Rank | In Labor Force | Age 30-34 |
| Delaware | 0.0 /100 | #277 | Tragic 83.5% |
| Fijians | 0.0 /100 | #278 | Tragic 83.4% |
| Immigrants | Fiji | 0.0 /100 | #279 | Tragic 83.4% |
| Africans | 0.0 /100 | #280 | Tragic 83.4% |
| Samoans | 0.0 /100 | #281 | Tragic 83.3% |
| Mexican American Indians | 0.0 /100 | #282 | Tragic 83.2% |
| Assyrians/Chaldeans/Syriacs | 0.0 /100 | #283 | Tragic 83.2% |
| Immigrants | Belize | 0.0 /100 | #284 | Tragic 83.2% |
| Cree | 0.0 /100 | #285 | Tragic 83.2% |
| Immigrants | Latin America | 0.0 /100 | #286 | Tragic 83.1% |
| Native Hawaiians | 0.0 /100 | #287 | Tragic 83.0% |
| Central American Indians | 0.0 /100 | #288 | Tragic 83.0% |
| Hawaiians | 0.0 /100 | #289 | Tragic 83.0% |
| Blackfeet | 0.0 /100 | #290 | Tragic 82.8% |
| Potawatomi | 0.0 /100 | #291 | Tragic 82.8% |