Scandinavian vs Apache Householder Income Over 65 years
COMPARE
Scandinavian
Apache
Householder Income Over 65 years
Householder Income Over 65 years Comparison
Scandinavians
Apache
$61,586
HOUSEHOLDER INCOME OVER 65 YEARS
65.6/ 100
METRIC RATING
156th/ 347
METRIC RANK
$54,668
HOUSEHOLDER INCOME OVER 65 YEARS
0.1/ 100
METRIC RATING
264th/ 347
METRIC RANK
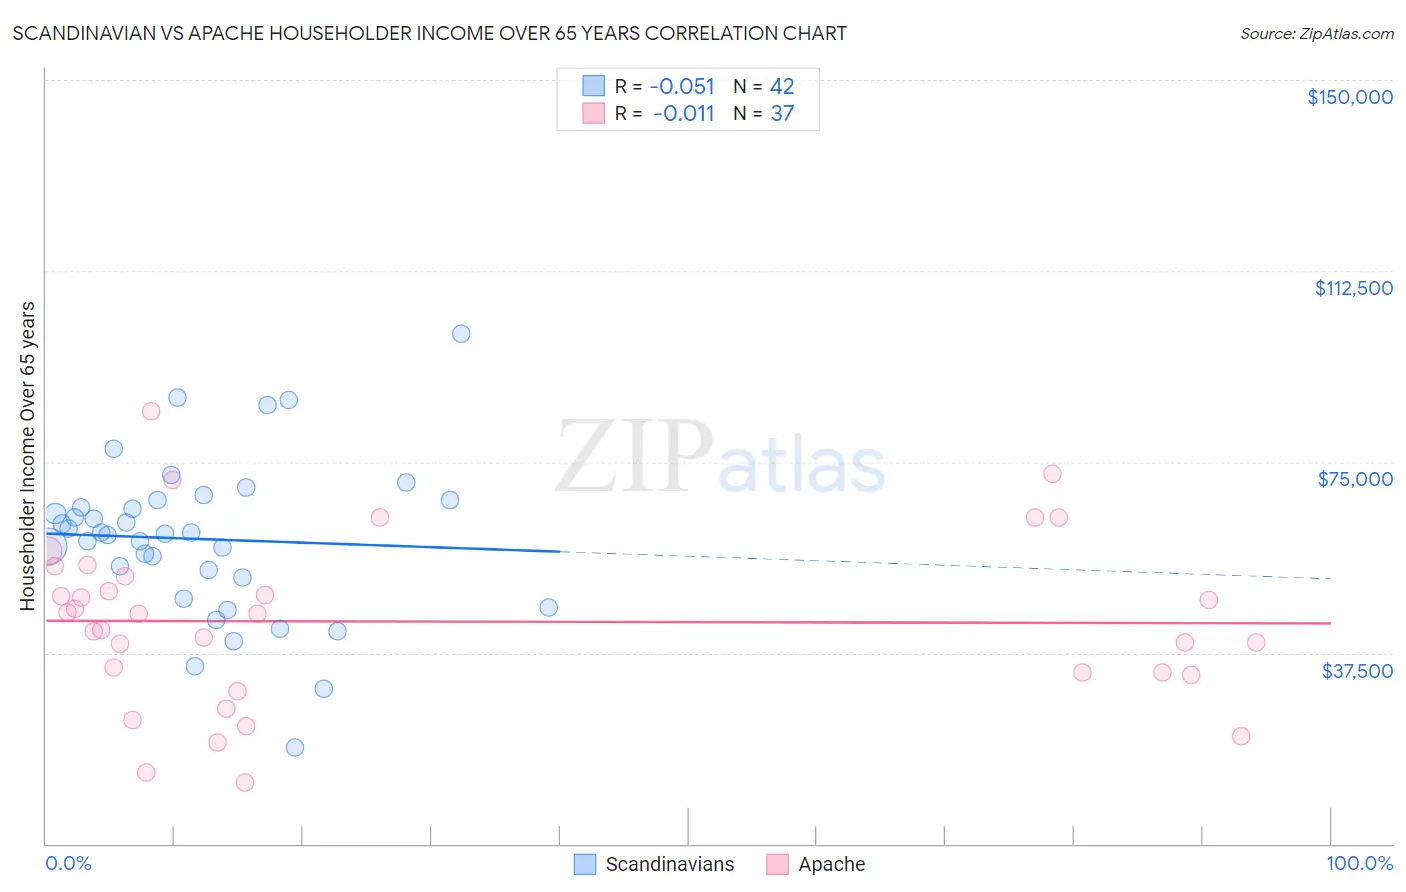
Scandinavian vs Apache Householder Income Over 65 years Correlation Chart
The statistical analysis conducted on geographies consisting of 470,228,291 people shows a slight negative correlation between the proportion of Scandinavians and household income with householder over the age of 65 in the United States with a correlation coefficient (R) of -0.051 and weighted average of $61,586. Similarly, the statistical analysis conducted on geographies consisting of 230,476,879 people shows no correlation between the proportion of Apache and household income with householder over the age of 65 in the United States with a correlation coefficient (R) of -0.011 and weighted average of $54,668, a difference of 12.7%.
Householder Income Over 65 years Correlation Summary
| Measurement | Scandinavian | Apache |
| Minimum | $18,992 | $12,094 |
| Maximum | $100,104 | $84,879 |
| Range | $81,112 | $72,785 |
| Mean | $59,842 | $43,630 |
| Median | $60,960 | $45,246 |
| Interquartile 25% (IQ1) | $52,396 | $33,376 |
| Interquartile 75% (IQ3) | $67,455 | $53,465 |
| Interquartile Range (IQR) | $15,058 | $20,089 |
| Standard Deviation (Sample) | $15,633 | $16,595 |
| Standard Deviation (Population) | $15,446 | $16,369 |
Similar Demographics by Householder Income Over 65 years
Demographics Similar to Scandinavians by Householder Income Over 65 years
In terms of householder income over 65 years, the demographic groups most similar to Scandinavians are Polish ($61,598, a difference of 0.020%), Macedonian ($61,564, a difference of 0.040%), Swiss ($61,621, a difference of 0.060%), Costa Rican ($61,638, a difference of 0.080%), and Armenian ($61,656, a difference of 0.11%).
| Demographics | Rating | Rank | Householder Income Over 65 years |
| Scottish | 69.1 /100 | #149 | Good $61,735 |
| Slavs | 68.5 /100 | #150 | Good $61,709 |
| Hungarians | 67.7 /100 | #151 | Good $61,673 |
| Armenians | 67.3 /100 | #152 | Good $61,656 |
| Costa Ricans | 66.9 /100 | #153 | Good $61,638 |
| Swiss | 66.5 /100 | #154 | Good $61,621 |
| Poles | 65.9 /100 | #155 | Good $61,598 |
| Scandinavians | 65.6 /100 | #156 | Good $61,586 |
| Macedonians | 65.1 /100 | #157 | Good $61,564 |
| English | 63.3 /100 | #158 | Good $61,487 |
| Brazilians | 62.7 /100 | #159 | Good $61,465 |
| Portuguese | 62.1 /100 | #160 | Good $61,440 |
| Icelanders | 57.9 /100 | #161 | Average $61,270 |
| Czechs | 57.2 /100 | #162 | Average $61,244 |
| Ugandans | 55.5 /100 | #163 | Average $61,177 |
Demographics Similar to Apache by Householder Income Over 65 years
In terms of householder income over 65 years, the demographic groups most similar to Apache are French American Indian ($54,699, a difference of 0.060%), Bangladeshi ($54,719, a difference of 0.090%), Belizean ($54,580, a difference of 0.16%), Jamaican ($54,560, a difference of 0.20%), and Guatemalan ($54,526, a difference of 0.26%).
| Demographics | Rating | Rank | Householder Income Over 65 years |
| Trinidadians and Tobagonians | 0.3 /100 | #257 | Tragic $55,327 |
| Ecuadorians | 0.2 /100 | #258 | Tragic $54,958 |
| West Indians | 0.2 /100 | #259 | Tragic $54,936 |
| Immigrants | West Indies | 0.2 /100 | #260 | Tragic $54,927 |
| Comanche | 0.2 /100 | #261 | Tragic $54,922 |
| Bangladeshis | 0.1 /100 | #262 | Tragic $54,719 |
| French American Indians | 0.1 /100 | #263 | Tragic $54,699 |
| Apache | 0.1 /100 | #264 | Tragic $54,668 |
| Belizeans | 0.1 /100 | #265 | Tragic $54,580 |
| Jamaicans | 0.1 /100 | #266 | Tragic $54,560 |
| Guatemalans | 0.1 /100 | #267 | Tragic $54,526 |
| Immigrants | Zaire | 0.1 /100 | #268 | Tragic $54,512 |
| Nicaraguans | 0.1 /100 | #269 | Tragic $54,474 |
| Immigrants | Senegal | 0.1 /100 | #270 | Tragic $54,447 |
| Liberians | 0.1 /100 | #271 | Tragic $54,356 |