Kiowa vs Paraguayan Professional Degree
COMPARE
Kiowa
Paraguayan
Professional Degree
Professional Degree Comparison
Kiowa
Paraguayans
3.1%
PROFESSIONAL DEGREE
0.0/ 100
METRIC RATING
331st/ 347
METRIC RANK
5.9%
PROFESSIONAL DEGREE
100.0/ 100
METRIC RATING
48th/ 347
METRIC RANK
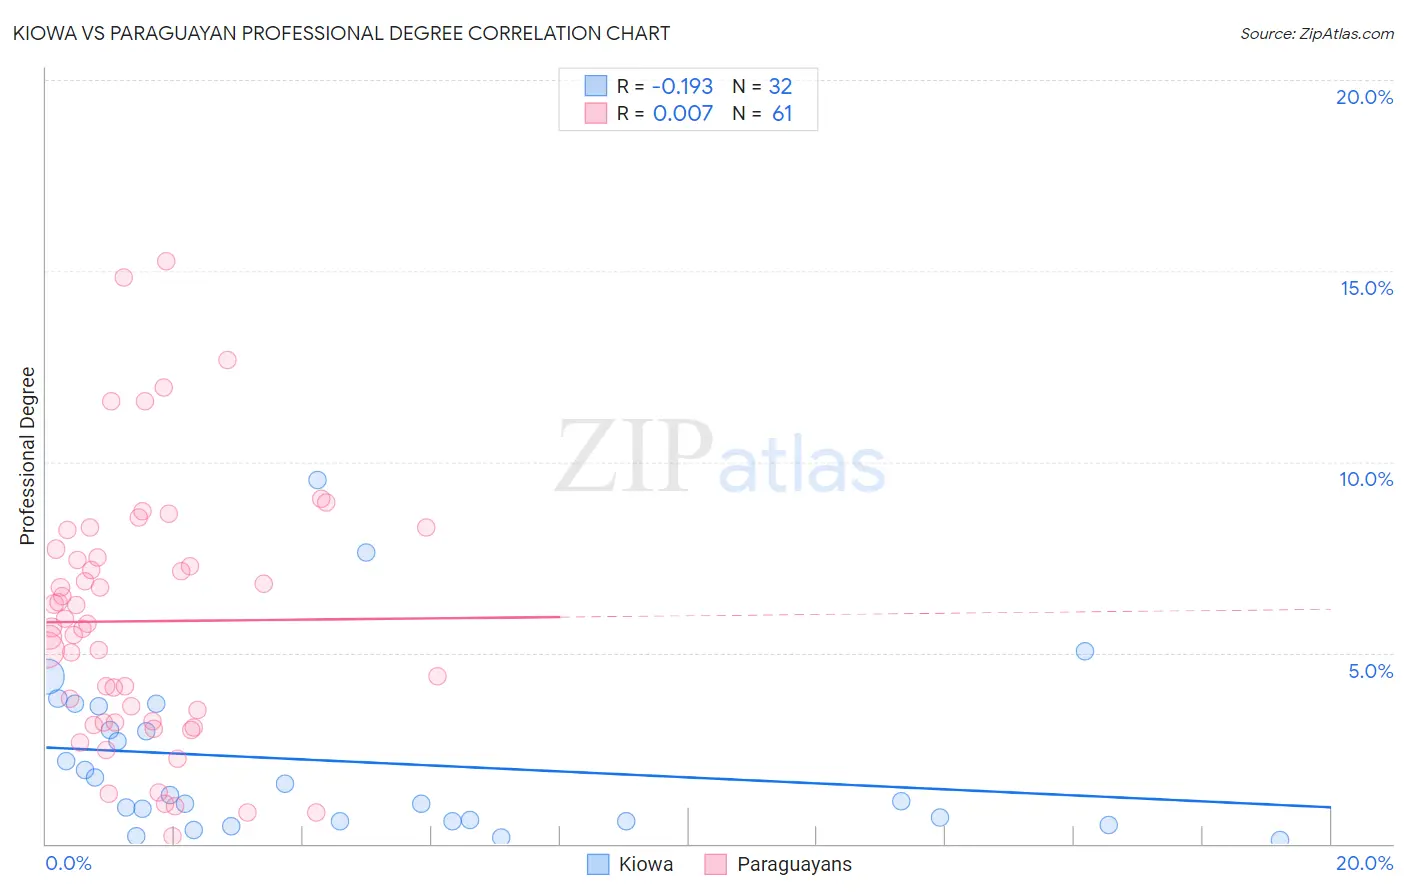
Kiowa vs Paraguayan Professional Degree Correlation Chart
The statistical analysis conducted on geographies consisting of 56,015,287 people shows a poor negative correlation between the proportion of Kiowa and percentage of population with at least professional degree education in the United States with a correlation coefficient (R) of -0.193 and weighted average of 3.1%. Similarly, the statistical analysis conducted on geographies consisting of 95,046,034 people shows no correlation between the proportion of Paraguayans and percentage of population with at least professional degree education in the United States with a correlation coefficient (R) of 0.007 and weighted average of 5.9%, a difference of 90.1%.
Professional Degree Correlation Summary
| Measurement | Kiowa | Paraguayan |
| Minimum | 0.082% | 0.21% |
| Maximum | 9.5% | 15.3% |
| Range | 9.4% | 15.1% |
| Mean | 2.1% | 5.8% |
| Median | 1.2% | 5.7% |
| Interquartile 25% (IQ1) | 0.60% | 3.2% |
| Interquartile 75% (IQ3) | 3.3% | 7.6% |
| Interquartile Range (IQR) | 2.7% | 4.4% |
| Standard Deviation (Sample) | 2.2% | 3.4% |
| Standard Deviation (Population) | 2.2% | 3.3% |
Similar Demographics by Professional Degree
Demographics Similar to Kiowa by Professional Degree
In terms of professional degree, the demographic groups most similar to Kiowa are Yakama (3.1%, a difference of 0.11%), Immigrants from Cabo Verde (3.1%, a difference of 0.12%), Puget Sound Salish (3.1%, a difference of 0.14%), Bangladeshi (3.1%, a difference of 0.20%), and Creek (3.1%, a difference of 0.41%).
| Demographics | Rating | Rank | Professional Degree |
| Crow | 0.0 /100 | #324 | Tragic 3.2% |
| Yaqui | 0.0 /100 | #325 | Tragic 3.2% |
| Menominee | 0.0 /100 | #326 | Tragic 3.1% |
| Dutch West Indians | 0.0 /100 | #327 | Tragic 3.1% |
| Creek | 0.0 /100 | #328 | Tragic 3.1% |
| Bangladeshis | 0.0 /100 | #329 | Tragic 3.1% |
| Immigrants | Cabo Verde | 0.0 /100 | #330 | Tragic 3.1% |
| Kiowa | 0.0 /100 | #331 | Tragic 3.1% |
| Yakama | 0.0 /100 | #332 | Tragic 3.1% |
| Puget Sound Salish | 0.0 /100 | #333 | Tragic 3.1% |
| Pennsylvania Germans | 0.0 /100 | #334 | Tragic 3.0% |
| Natives/Alaskans | 0.0 /100 | #335 | Tragic 3.0% |
| Fijians | 0.0 /100 | #336 | Tragic 2.9% |
| Arapaho | 0.0 /100 | #337 | Tragic 2.9% |
| Navajo | 0.0 /100 | #338 | Tragic 2.9% |
Demographics Similar to Paraguayans by Professional Degree
In terms of professional degree, the demographic groups most similar to Paraguayans are Immigrants from Latvia (5.8%, a difference of 0.40%), Australian (5.9%, a difference of 0.42%), Immigrants from Argentina (5.9%, a difference of 0.43%), Immigrants from South Central Asia (5.9%, a difference of 0.63%), and Immigrants from Czechoslovakia (5.8%, a difference of 0.72%).
| Demographics | Rating | Rank | Professional Degree |
| New Zealanders | 100.0 /100 | #41 | Exceptional 6.0% |
| Estonians | 100.0 /100 | #42 | Exceptional 6.0% |
| Immigrants | Saudi Arabia | 100.0 /100 | #43 | Exceptional 5.9% |
| Argentineans | 100.0 /100 | #44 | Exceptional 5.9% |
| Immigrants | South Central Asia | 100.0 /100 | #45 | Exceptional 5.9% |
| Immigrants | Argentina | 100.0 /100 | #46 | Exceptional 5.9% |
| Australians | 100.0 /100 | #47 | Exceptional 5.9% |
| Paraguayans | 100.0 /100 | #48 | Exceptional 5.9% |
| Immigrants | Latvia | 100.0 /100 | #49 | Exceptional 5.8% |
| Immigrants | Czechoslovakia | 100.0 /100 | #50 | Exceptional 5.8% |
| Immigrants | Greece | 100.0 /100 | #51 | Exceptional 5.8% |
| Immigrants | Serbia | 100.0 /100 | #52 | Exceptional 5.8% |
| Immigrants | Netherlands | 100.0 /100 | #53 | Exceptional 5.8% |
| Immigrants | Kuwait | 100.0 /100 | #54 | Exceptional 5.7% |
| Immigrants | Western Europe | 100.0 /100 | #55 | Exceptional 5.7% |