Kenyan vs Immigrants from Cuba Householder Income Ages 25 - 44 years
COMPARE
Kenyan
Immigrants from Cuba
Householder Income Ages 25 - 44 years
Householder Income Ages 25 - 44 years Comparison
Kenyans
Immigrants from Cuba
$91,684
HOUSEHOLDER INCOME AGES 25 - 44 YEARS
16.8/ 100
METRIC RATING
199th/ 347
METRIC RANK
$76,701
HOUSEHOLDER INCOME AGES 25 - 44 YEARS
0.0/ 100
METRIC RATING
328th/ 347
METRIC RANK
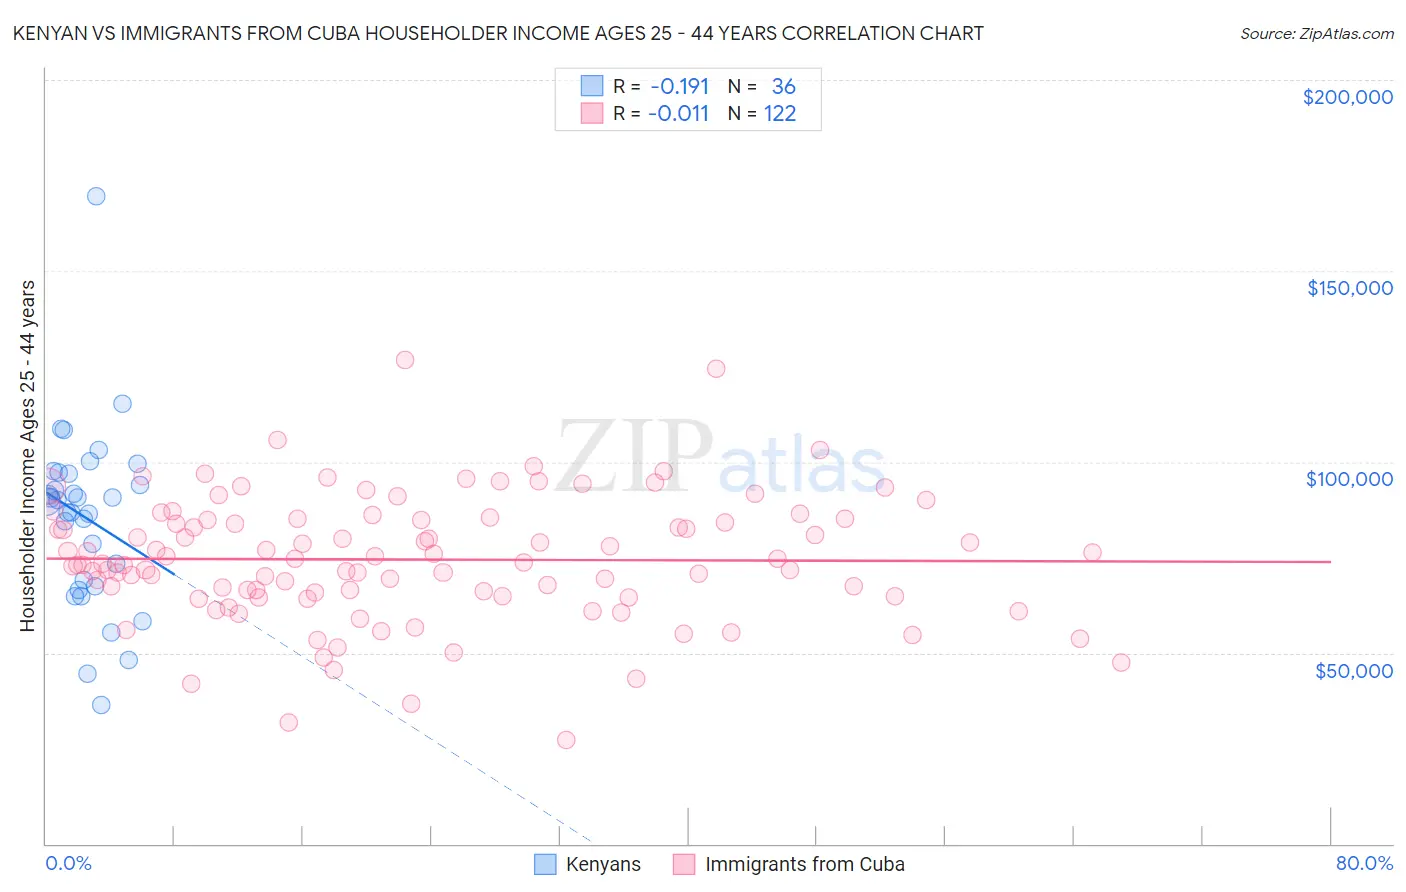
Kenyan vs Immigrants from Cuba Householder Income Ages 25 - 44 years Correlation Chart
The statistical analysis conducted on geographies consisting of 168,058,710 people shows a poor negative correlation between the proportion of Kenyans and household income with householder between the ages 25 and 44 in the United States with a correlation coefficient (R) of -0.191 and weighted average of $91,684. Similarly, the statistical analysis conducted on geographies consisting of 325,310,013 people shows no correlation between the proportion of Immigrants from Cuba and household income with householder between the ages 25 and 44 in the United States with a correlation coefficient (R) of -0.011 and weighted average of $76,701, a difference of 19.5%.
Householder Income Ages 25 - 44 years Correlation Summary
| Measurement | Kenyan | Immigrants from Cuba |
| Minimum | $36,414 | $27,269 |
| Maximum | $169,412 | $126,663 |
| Range | $132,998 | $99,394 |
| Mean | $85,374 | $74,412 |
| Median | $89,858 | $73,548 |
| Interquartile 25% (IQ1) | $68,236 | $64,878 |
| Interquartile 75% (IQ3) | $97,027 | $84,816 |
| Interquartile Range (IQR) | $28,791 | $19,938 |
| Standard Deviation (Sample) | $23,657 | $16,521 |
| Standard Deviation (Population) | $23,326 | $16,454 |
Similar Demographics by Householder Income Ages 25 - 44 years
Demographics Similar to Kenyans by Householder Income Ages 25 - 44 years
In terms of householder income ages 25 - 44 years, the demographic groups most similar to Kenyans are White/Caucasian ($91,668, a difference of 0.020%), Japanese ($91,624, a difference of 0.070%), Ecuadorian ($91,574, a difference of 0.12%), Immigrants from Cambodia ($91,533, a difference of 0.16%), and Nepalese ($91,498, a difference of 0.20%).
| Demographics | Rating | Rank | Householder Income Ages 25 - 44 years |
| Immigrants | Costa Rica | 28.2 /100 | #192 | Fair $92,876 |
| Samoans | 23.0 /100 | #193 | Fair $92,385 |
| Immigrants | Azores | 22.4 /100 | #194 | Fair $92,322 |
| Celtics | 21.6 /100 | #195 | Fair $92,241 |
| Immigrants | Colombia | 21.3 /100 | #196 | Fair $92,204 |
| Spanish | 21.2 /100 | #197 | Fair $92,200 |
| Vietnamese | 20.2 /100 | #198 | Fair $92,089 |
| Kenyans | 16.8 /100 | #199 | Poor $91,684 |
| Whites/Caucasians | 16.7 /100 | #200 | Poor $91,668 |
| Japanese | 16.4 /100 | #201 | Poor $91,624 |
| Ecuadorians | 16.0 /100 | #202 | Poor $91,574 |
| Immigrants | Cambodia | 15.7 /100 | #203 | Poor $91,533 |
| Nepalese | 15.4 /100 | #204 | Poor $91,498 |
| Immigrants | Eastern Africa | 15.2 /100 | #205 | Poor $91,458 |
| Aleuts | 14.5 /100 | #206 | Poor $91,370 |
Demographics Similar to Immigrants from Cuba by Householder Income Ages 25 - 44 years
In terms of householder income ages 25 - 44 years, the demographic groups most similar to Immigrants from Cuba are Seminole ($76,584, a difference of 0.15%), Immigrants from Bahamas ($76,910, a difference of 0.27%), Houma ($77,044, a difference of 0.45%), Sioux ($77,089, a difference of 0.51%), and Yakama ($76,226, a difference of 0.62%).
| Demographics | Rating | Rank | Householder Income Ages 25 - 44 years |
| Immigrants | Zaire | 0.0 /100 | #321 | Tragic $78,045 |
| Chickasaw | 0.0 /100 | #322 | Tragic $77,929 |
| Immigrants | Honduras | 0.0 /100 | #323 | Tragic $77,328 |
| Dutch West Indians | 0.0 /100 | #324 | Tragic $77,260 |
| Sioux | 0.0 /100 | #325 | Tragic $77,089 |
| Houma | 0.0 /100 | #326 | Tragic $77,044 |
| Immigrants | Bahamas | 0.0 /100 | #327 | Tragic $76,910 |
| Immigrants | Cuba | 0.0 /100 | #328 | Tragic $76,701 |
| Seminole | 0.0 /100 | #329 | Tragic $76,584 |
| Yakama | 0.0 /100 | #330 | Tragic $76,226 |
| Natives/Alaskans | 0.0 /100 | #331 | Tragic $75,647 |
| Bahamians | 0.0 /100 | #332 | Tragic $75,395 |
| Hopi | 0.0 /100 | #333 | Tragic $75,002 |
| Creek | 0.0 /100 | #334 | Tragic $74,847 |
| Kiowa | 0.0 /100 | #335 | Tragic $74,776 |