Kenyan vs Immigrants from Egypt Householder Income Ages 25 - 44 years
COMPARE
Kenyan
Immigrants from Egypt
Householder Income Ages 25 - 44 years
Householder Income Ages 25 - 44 years Comparison
Kenyans
Immigrants from Egypt
$91,684
HOUSEHOLDER INCOME AGES 25 - 44 YEARS
16.8/ 100
METRIC RATING
199th/ 347
METRIC RANK
$103,192
HOUSEHOLDER INCOME AGES 25 - 44 YEARS
99.2/ 100
METRIC RATING
80th/ 347
METRIC RANK
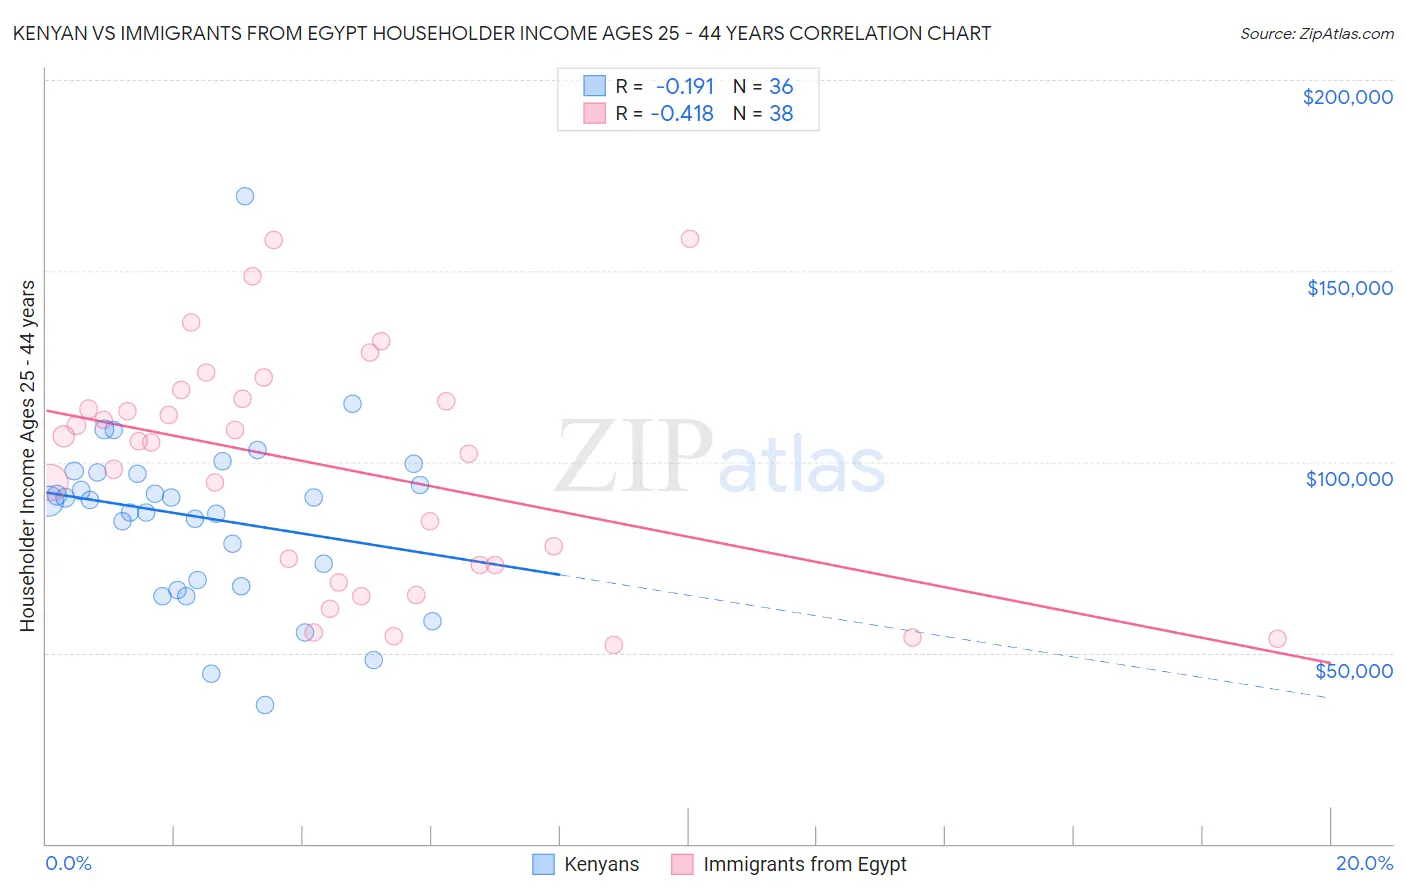
Kenyan vs Immigrants from Egypt Householder Income Ages 25 - 44 years Correlation Chart
The statistical analysis conducted on geographies consisting of 168,058,710 people shows a poor negative correlation between the proportion of Kenyans and household income with householder between the ages 25 and 44 in the United States with a correlation coefficient (R) of -0.191 and weighted average of $91,684. Similarly, the statistical analysis conducted on geographies consisting of 245,137,860 people shows a moderate negative correlation between the proportion of Immigrants from Egypt and household income with householder between the ages 25 and 44 in the United States with a correlation coefficient (R) of -0.418 and weighted average of $103,192, a difference of 12.6%.
Householder Income Ages 25 - 44 years Correlation Summary
| Measurement | Kenyan | Immigrants from Egypt |
| Minimum | $36,414 | $52,083 |
| Maximum | $169,412 | $158,487 |
| Range | $132,998 | $106,404 |
| Mean | $85,374 | $98,589 |
| Median | $89,858 | $105,246 |
| Interquartile 25% (IQ1) | $68,236 | $73,125 |
| Interquartile 75% (IQ3) | $97,027 | $116,638 |
| Interquartile Range (IQR) | $28,791 | $43,513 |
| Standard Deviation (Sample) | $23,657 | $30,067 |
| Standard Deviation (Population) | $23,326 | $29,669 |
Similar Demographics by Householder Income Ages 25 - 44 years
Demographics Similar to Kenyans by Householder Income Ages 25 - 44 years
In terms of householder income ages 25 - 44 years, the demographic groups most similar to Kenyans are White/Caucasian ($91,668, a difference of 0.020%), Japanese ($91,624, a difference of 0.070%), Ecuadorian ($91,574, a difference of 0.12%), Immigrants from Cambodia ($91,533, a difference of 0.16%), and Nepalese ($91,498, a difference of 0.20%).
| Demographics | Rating | Rank | Householder Income Ages 25 - 44 years |
| Immigrants | Costa Rica | 28.2 /100 | #192 | Fair $92,876 |
| Samoans | 23.0 /100 | #193 | Fair $92,385 |
| Immigrants | Azores | 22.4 /100 | #194 | Fair $92,322 |
| Celtics | 21.6 /100 | #195 | Fair $92,241 |
| Immigrants | Colombia | 21.3 /100 | #196 | Fair $92,204 |
| Spanish | 21.2 /100 | #197 | Fair $92,200 |
| Vietnamese | 20.2 /100 | #198 | Fair $92,089 |
| Kenyans | 16.8 /100 | #199 | Poor $91,684 |
| Whites/Caucasians | 16.7 /100 | #200 | Poor $91,668 |
| Japanese | 16.4 /100 | #201 | Poor $91,624 |
| Ecuadorians | 16.0 /100 | #202 | Poor $91,574 |
| Immigrants | Cambodia | 15.7 /100 | #203 | Poor $91,533 |
| Nepalese | 15.4 /100 | #204 | Poor $91,498 |
| Immigrants | Eastern Africa | 15.2 /100 | #205 | Poor $91,458 |
| Aleuts | 14.5 /100 | #206 | Poor $91,370 |
Demographics Similar to Immigrants from Egypt by Householder Income Ages 25 - 44 years
In terms of householder income ages 25 - 44 years, the demographic groups most similar to Immigrants from Egypt are South African ($103,160, a difference of 0.030%), Immigrants from Serbia ($103,155, a difference of 0.040%), Armenian ($103,248, a difference of 0.050%), Argentinean ($103,111, a difference of 0.080%), and Immigrants from Bulgaria ($103,423, a difference of 0.22%).
| Demographics | Rating | Rank | Householder Income Ages 25 - 44 years |
| Italians | 99.5 /100 | #73 | Exceptional $104,215 |
| Immigrants | Fiji | 99.5 /100 | #74 | Exceptional $103,954 |
| Koreans | 99.4 /100 | #75 | Exceptional $103,824 |
| Immigrants | Spain | 99.4 /100 | #76 | Exceptional $103,752 |
| Immigrants | Southern Europe | 99.3 /100 | #77 | Exceptional $103,486 |
| Immigrants | Bulgaria | 99.3 /100 | #78 | Exceptional $103,423 |
| Armenians | 99.2 /100 | #79 | Exceptional $103,248 |
| Immigrants | Egypt | 99.2 /100 | #80 | Exceptional $103,192 |
| South Africans | 99.2 /100 | #81 | Exceptional $103,160 |
| Immigrants | Serbia | 99.2 /100 | #82 | Exceptional $103,155 |
| Argentineans | 99.1 /100 | #83 | Exceptional $103,111 |
| Immigrants | Philippines | 99.0 /100 | #84 | Exceptional $102,910 |
| Immigrants | Ukraine | 98.9 /100 | #85 | Exceptional $102,664 |
| Immigrants | Hungary | 98.9 /100 | #86 | Exceptional $102,655 |
| Immigrants | Western Europe | 98.9 /100 | #87 | Exceptional $102,654 |