Immigrants from Mexico vs Yup'ik Median Family Income
COMPARE
Immigrants from Mexico
Yup'ik
Median Family Income
Median Family Income Comparison
Immigrants from Mexico
Yup'ik
$83,639
MEDIAN FAMILY INCOME
0.0/ 100
METRIC RATING
318th/ 347
METRIC RANK
$79,290
MEDIAN FAMILY INCOME
0.0/ 100
METRIC RATING
335th/ 347
METRIC RANK
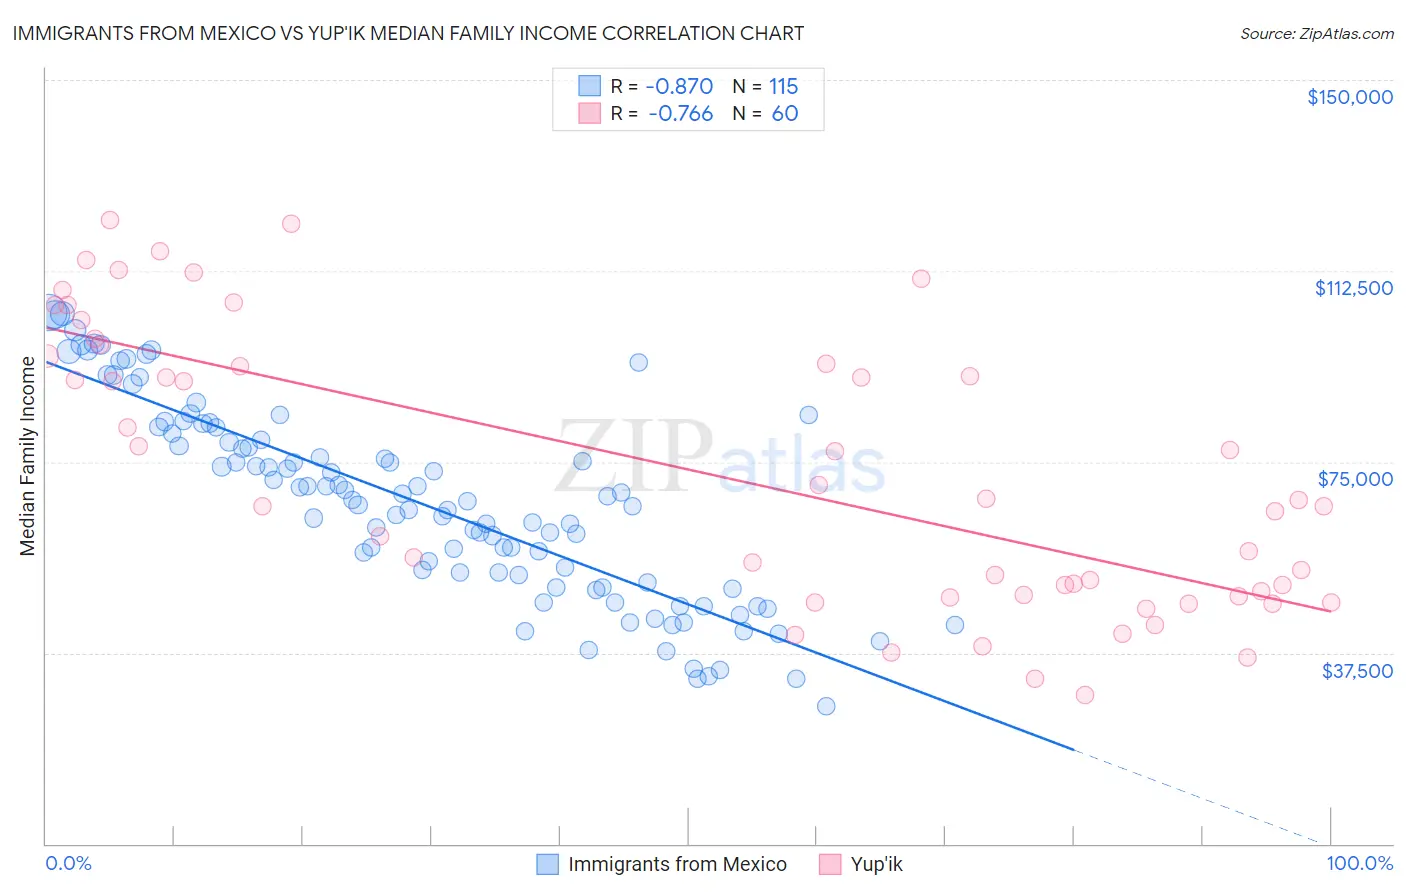
Immigrants from Mexico vs Yup'ik Median Family Income Correlation Chart
The statistical analysis conducted on geographies consisting of 512,958,720 people shows a very strong negative correlation between the proportion of Immigrants from Mexico and median family income in the United States with a correlation coefficient (R) of -0.870 and weighted average of $83,639. Similarly, the statistical analysis conducted on geographies consisting of 39,952,310 people shows a strong negative correlation between the proportion of Yup'ik and median family income in the United States with a correlation coefficient (R) of -0.766 and weighted average of $79,290, a difference of 5.5%.
Median Family Income Correlation Summary
| Measurement | Immigrants from Mexico | Yup'ik |
| Minimum | $27,125 | $29,250 |
| Maximum | $104,446 | $122,399 |
| Range | $77,321 | $93,149 |
| Mean | $66,857 | $72,637 |
| Median | $67,328 | $66,875 |
| Interquartile 25% (IQ1) | $51,313 | $48,824 |
| Interquartile 75% (IQ3) | $80,504 | $95,045 |
| Interquartile Range (IQR) | $29,191 | $46,221 |
| Standard Deviation (Sample) | $19,043 | $27,024 |
| Standard Deviation (Population) | $18,960 | $26,798 |
Demographics Similar to Immigrants from Mexico and Yup'ik by Median Family Income
In terms of median family income, the demographic groups most similar to Immigrants from Mexico are Immigrants from Honduras ($83,618, a difference of 0.030%), Seminole ($83,354, a difference of 0.34%), Yakama ($83,932, a difference of 0.35%), Immigrants from Caribbean ($83,319, a difference of 0.38%), and Immigrants from Haiti ($84,018, a difference of 0.45%). Similarly, the demographic groups most similar to Yup'ik are Menominee ($79,563, a difference of 0.34%), Immigrants from Cuba ($78,249, a difference of 1.3%), Kiowa ($80,885, a difference of 2.0%), Native/Alaskan ($80,908, a difference of 2.0%), and Immigrants from Dominican Republic ($81,233, a difference of 2.5%).
| Demographics | Rating | Rank | Median Family Income |
| Immigrants | Haiti | 0.0 /100 | #316 | Tragic $84,018 |
| Yakama | 0.0 /100 | #317 | Tragic $83,932 |
| Immigrants | Mexico | 0.0 /100 | #318 | Tragic $83,639 |
| Immigrants | Honduras | 0.0 /100 | #319 | Tragic $83,618 |
| Seminole | 0.0 /100 | #320 | Tragic $83,354 |
| Immigrants | Caribbean | 0.0 /100 | #321 | Tragic $83,319 |
| Dominicans | 0.0 /100 | #322 | Tragic $82,888 |
| Bahamians | 0.0 /100 | #323 | Tragic $82,631 |
| Creek | 0.0 /100 | #324 | Tragic $82,560 |
| Sioux | 0.0 /100 | #325 | Tragic $82,386 |
| Immigrants | Congo | 0.0 /100 | #326 | Tragic $82,216 |
| Arapaho | 0.0 /100 | #327 | Tragic $82,064 |
| Blacks/African Americans | 0.0 /100 | #328 | Tragic $81,912 |
| Dutch West Indians | 0.0 /100 | #329 | Tragic $81,852 |
| Cheyenne | 0.0 /100 | #330 | Tragic $81,385 |
| Immigrants | Dominican Republic | 0.0 /100 | #331 | Tragic $81,233 |
| Natives/Alaskans | 0.0 /100 | #332 | Tragic $80,908 |
| Kiowa | 0.0 /100 | #333 | Tragic $80,885 |
| Menominee | 0.0 /100 | #334 | Tragic $79,563 |
| Yup'ik | 0.0 /100 | #335 | Tragic $79,290 |
| Immigrants | Cuba | 0.0 /100 | #336 | Tragic $78,249 |