Japanese vs Egyptian Per Capita Income
COMPARE
Japanese
Egyptian
Per Capita Income
Per Capita Income Comparison
Japanese
Egyptians
$39,870
PER CAPITA INCOME
1.4/ 100
METRIC RATING
249th/ 347
METRIC RANK
$48,358
PER CAPITA INCOME
99.5/ 100
METRIC RATING
80th/ 347
METRIC RANK
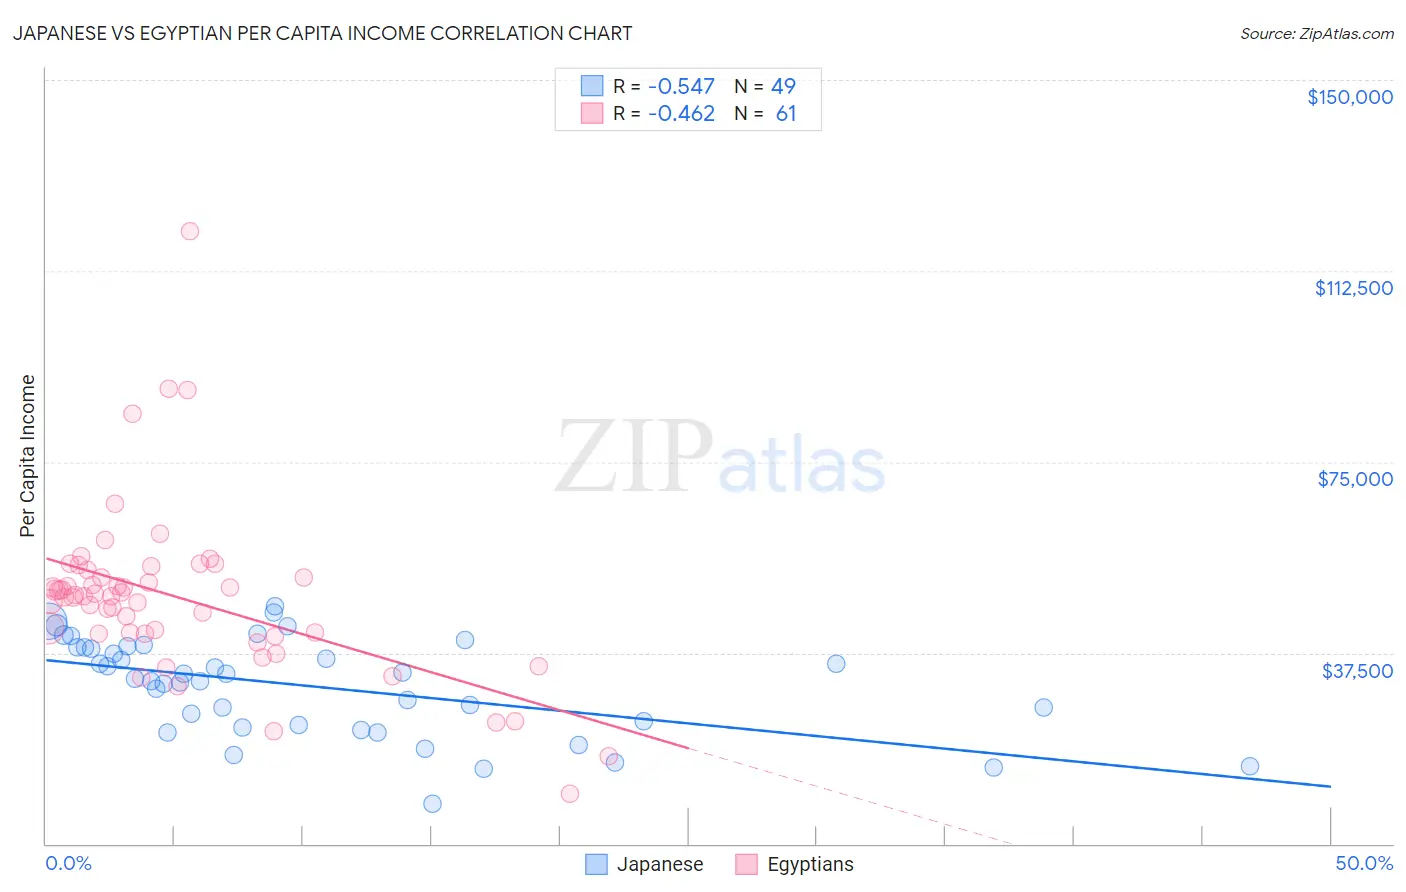
Japanese vs Egyptian Per Capita Income Correlation Chart
The statistical analysis conducted on geographies consisting of 249,192,968 people shows a substantial negative correlation between the proportion of Japanese and per capita income in the United States with a correlation coefficient (R) of -0.547 and weighted average of $39,870. Similarly, the statistical analysis conducted on geographies consisting of 276,936,692 people shows a moderate negative correlation between the proportion of Egyptians and per capita income in the United States with a correlation coefficient (R) of -0.462 and weighted average of $48,358, a difference of 21.3%.
Per Capita Income Correlation Summary
| Measurement | Japanese | Egyptian |
| Minimum | $7,849 | $9,805 |
| Maximum | $46,714 | $120,225 |
| Range | $38,865 | $110,420 |
| Mean | $30,879 | $48,391 |
| Median | $32,329 | $48,690 |
| Interquartile 25% (IQ1) | $23,174 | $41,170 |
| Interquartile 75% (IQ3) | $38,578 | $53,076 |
| Interquartile Range (IQR) | $15,404 | $11,906 |
| Standard Deviation (Sample) | $9,433 | $16,881 |
| Standard Deviation (Population) | $9,336 | $16,742 |
Similar Demographics by Per Capita Income
Demographics Similar to Japanese by Per Capita Income
In terms of per capita income, the demographic groups most similar to Japanese are Immigrants from Burma/Myanmar ($39,827, a difference of 0.11%), Samoan ($39,826, a difference of 0.11%), Cape Verdean ($39,935, a difference of 0.16%), Immigrants from Somalia ($39,974, a difference of 0.26%), and Cree ($40,056, a difference of 0.46%).
| Demographics | Rating | Rank | Per Capita Income |
| Immigrants | Western Africa | 2.2 /100 | #242 | Tragic $40,294 |
| German Russians | 2.2 /100 | #243 | Tragic $40,266 |
| French American Indians | 2.1 /100 | #244 | Tragic $40,244 |
| Sub-Saharan Africans | 1.9 /100 | #245 | Tragic $40,152 |
| Cree | 1.7 /100 | #246 | Tragic $40,056 |
| Immigrants | Somalia | 1.6 /100 | #247 | Tragic $39,974 |
| Cape Verdeans | 1.5 /100 | #248 | Tragic $39,935 |
| Japanese | 1.4 /100 | #249 | Tragic $39,870 |
| Immigrants | Burma/Myanmar | 1.3 /100 | #250 | Tragic $39,827 |
| Samoans | 1.3 /100 | #251 | Tragic $39,826 |
| Immigrants | Azores | 1.0 /100 | #252 | Tragic $39,608 |
| Osage | 1.0 /100 | #253 | Tragic $39,568 |
| Alaska Natives | 1.0 /100 | #254 | Tragic $39,558 |
| Immigrants | Middle Africa | 1.0 /100 | #255 | Tragic $39,529 |
| Hawaiians | 0.8 /100 | #256 | Tragic $39,403 |
Demographics Similar to Egyptians by Per Capita Income
In terms of per capita income, the demographic groups most similar to Egyptians are Armenian ($48,287, a difference of 0.15%), Romanian ($48,445, a difference of 0.18%), Immigrants from Indonesia ($48,195, a difference of 0.34%), Immigrants from Brazil ($48,164, a difference of 0.40%), and Immigrants from Ukraine ($48,134, a difference of 0.46%).
| Demographics | Rating | Rank | Per Capita Income |
| Immigrants | North America | 99.8 /100 | #73 | Exceptional $49,302 |
| Mongolians | 99.8 /100 | #74 | Exceptional $49,173 |
| Immigrants | Bolivia | 99.7 /100 | #75 | Exceptional $48,970 |
| Immigrants | England | 99.7 /100 | #76 | Exceptional $48,844 |
| Immigrants | Kazakhstan | 99.7 /100 | #77 | Exceptional $48,747 |
| Immigrants | Italy | 99.6 /100 | #78 | Exceptional $48,654 |
| Romanians | 99.5 /100 | #79 | Exceptional $48,445 |
| Egyptians | 99.5 /100 | #80 | Exceptional $48,358 |
| Armenians | 99.4 /100 | #81 | Exceptional $48,287 |
| Immigrants | Indonesia | 99.4 /100 | #82 | Exceptional $48,195 |
| Immigrants | Brazil | 99.4 /100 | #83 | Exceptional $48,164 |
| Immigrants | Ukraine | 99.3 /100 | #84 | Exceptional $48,134 |
| Austrians | 99.3 /100 | #85 | Exceptional $48,116 |
| Immigrants | Southern Europe | 99.3 /100 | #86 | Exceptional $48,027 |
| Ukrainians | 99.3 /100 | #87 | Exceptional $48,014 |