Jamaican vs Kiowa Householder Income Over 65 years
COMPARE
Jamaican
Kiowa
Householder Income Over 65 years
Householder Income Over 65 years Comparison
Jamaicans
Kiowa
$54,560
HOUSEHOLDER INCOME OVER 65 YEARS
0.1/ 100
METRIC RATING
266th/ 347
METRIC RANK
$51,140
HOUSEHOLDER INCOME OVER 65 YEARS
0.0/ 100
METRIC RATING
326th/ 347
METRIC RANK
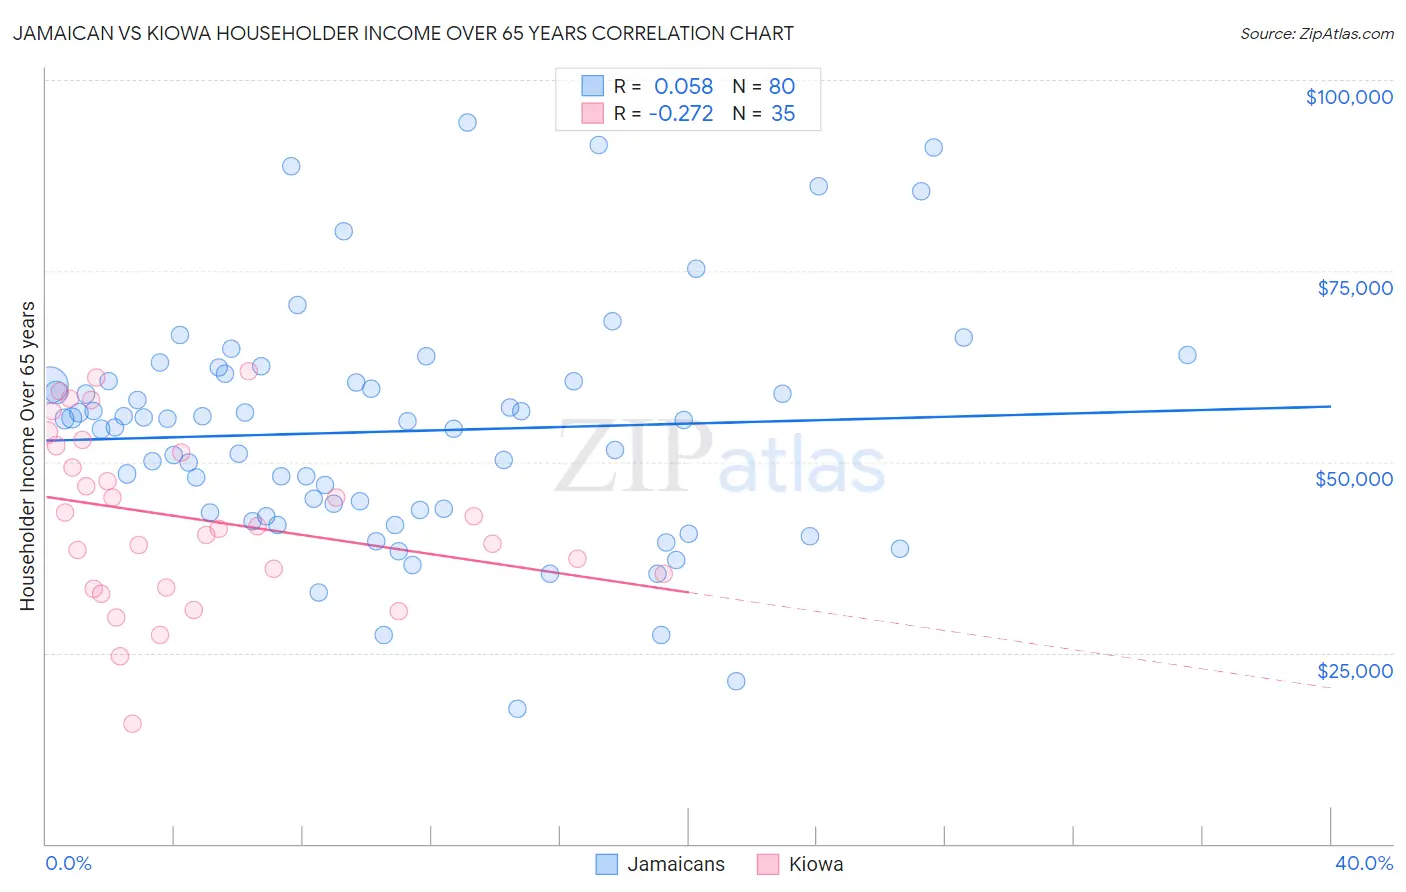
Jamaican vs Kiowa Householder Income Over 65 years Correlation Chart
The statistical analysis conducted on geographies consisting of 366,342,723 people shows a slight positive correlation between the proportion of Jamaicans and household income with householder over the age of 65 in the United States with a correlation coefficient (R) of 0.058 and weighted average of $54,560. Similarly, the statistical analysis conducted on geographies consisting of 56,056,100 people shows a weak negative correlation between the proportion of Kiowa and household income with householder over the age of 65 in the United States with a correlation coefficient (R) of -0.272 and weighted average of $51,140, a difference of 6.7%.
Householder Income Over 65 years Correlation Summary
| Measurement | Jamaican | Kiowa |
| Minimum | $17,596 | $15,714 |
| Maximum | $94,474 | $61,875 |
| Range | $76,878 | $46,161 |
| Mean | $53,994 | $42,635 |
| Median | $55,397 | $41,563 |
| Interquartile 25% (IQ1) | $43,595 | $33,542 |
| Interquartile 75% (IQ3) | $60,577 | $52,128 |
| Interquartile Range (IQR) | $16,982 | $18,586 |
| Standard Deviation (Sample) | $15,398 | $11,308 |
| Standard Deviation (Population) | $15,302 | $11,146 |
Similar Demographics by Householder Income Over 65 years
Demographics Similar to Jamaicans by Householder Income Over 65 years
In terms of householder income over 65 years, the demographic groups most similar to Jamaicans are Belizean ($54,580, a difference of 0.040%), Guatemalan ($54,526, a difference of 0.060%), Immigrants from Zaire ($54,512, a difference of 0.090%), Nicaraguan ($54,474, a difference of 0.16%), and Apache ($54,668, a difference of 0.20%).
| Demographics | Rating | Rank | Householder Income Over 65 years |
| West Indians | 0.2 /100 | #259 | Tragic $54,936 |
| Immigrants | West Indies | 0.2 /100 | #260 | Tragic $54,927 |
| Comanche | 0.2 /100 | #261 | Tragic $54,922 |
| Bangladeshis | 0.1 /100 | #262 | Tragic $54,719 |
| French American Indians | 0.1 /100 | #263 | Tragic $54,699 |
| Apache | 0.1 /100 | #264 | Tragic $54,668 |
| Belizeans | 0.1 /100 | #265 | Tragic $54,580 |
| Jamaicans | 0.1 /100 | #266 | Tragic $54,560 |
| Guatemalans | 0.1 /100 | #267 | Tragic $54,526 |
| Immigrants | Zaire | 0.1 /100 | #268 | Tragic $54,512 |
| Nicaraguans | 0.1 /100 | #269 | Tragic $54,474 |
| Immigrants | Senegal | 0.1 /100 | #270 | Tragic $54,447 |
| Liberians | 0.1 /100 | #271 | Tragic $54,356 |
| Potawatomi | 0.1 /100 | #272 | Tragic $54,212 |
| Indonesians | 0.1 /100 | #273 | Tragic $54,176 |
Demographics Similar to Kiowa by Householder Income Over 65 years
In terms of householder income over 65 years, the demographic groups most similar to Kiowa are Immigrants from Haiti ($51,219, a difference of 0.15%), Bahamian ($51,000, a difference of 0.28%), Hopi ($50,925, a difference of 0.42%), Immigrants from Congo ($51,393, a difference of 0.49%), and Cajun ($51,397, a difference of 0.50%).
| Demographics | Rating | Rank | Householder Income Over 65 years |
| Immigrants | Honduras | 0.0 /100 | #319 | Tragic $51,888 |
| Colville | 0.0 /100 | #320 | Tragic $51,739 |
| Menominee | 0.0 /100 | #321 | Tragic $51,719 |
| British West Indians | 0.0 /100 | #322 | Tragic $51,463 |
| Cajuns | 0.0 /100 | #323 | Tragic $51,397 |
| Immigrants | Congo | 0.0 /100 | #324 | Tragic $51,393 |
| Immigrants | Haiti | 0.0 /100 | #325 | Tragic $51,219 |
| Kiowa | 0.0 /100 | #326 | Tragic $51,140 |
| Bahamians | 0.0 /100 | #327 | Tragic $51,000 |
| Hopi | 0.0 /100 | #328 | Tragic $50,925 |
| Blacks/African Americans | 0.0 /100 | #329 | Tragic $50,779 |
| Immigrants | Grenada | 0.0 /100 | #330 | Tragic $50,747 |
| Pima | 0.0 /100 | #331 | Tragic $50,539 |
| Dutch West Indians | 0.0 /100 | #332 | Tragic $50,475 |
| Cape Verdeans | 0.0 /100 | #333 | Tragic $50,077 |