Basque vs Kiowa Householder Income Over 65 years
COMPARE
Basque
Kiowa
Householder Income Over 65 years
Householder Income Over 65 years Comparison
Basques
Kiowa
$62,653
HOUSEHOLDER INCOME OVER 65 YEARS
85.4/ 100
METRIC RATING
130th/ 347
METRIC RANK
$51,140
HOUSEHOLDER INCOME OVER 65 YEARS
0.0/ 100
METRIC RATING
326th/ 347
METRIC RANK
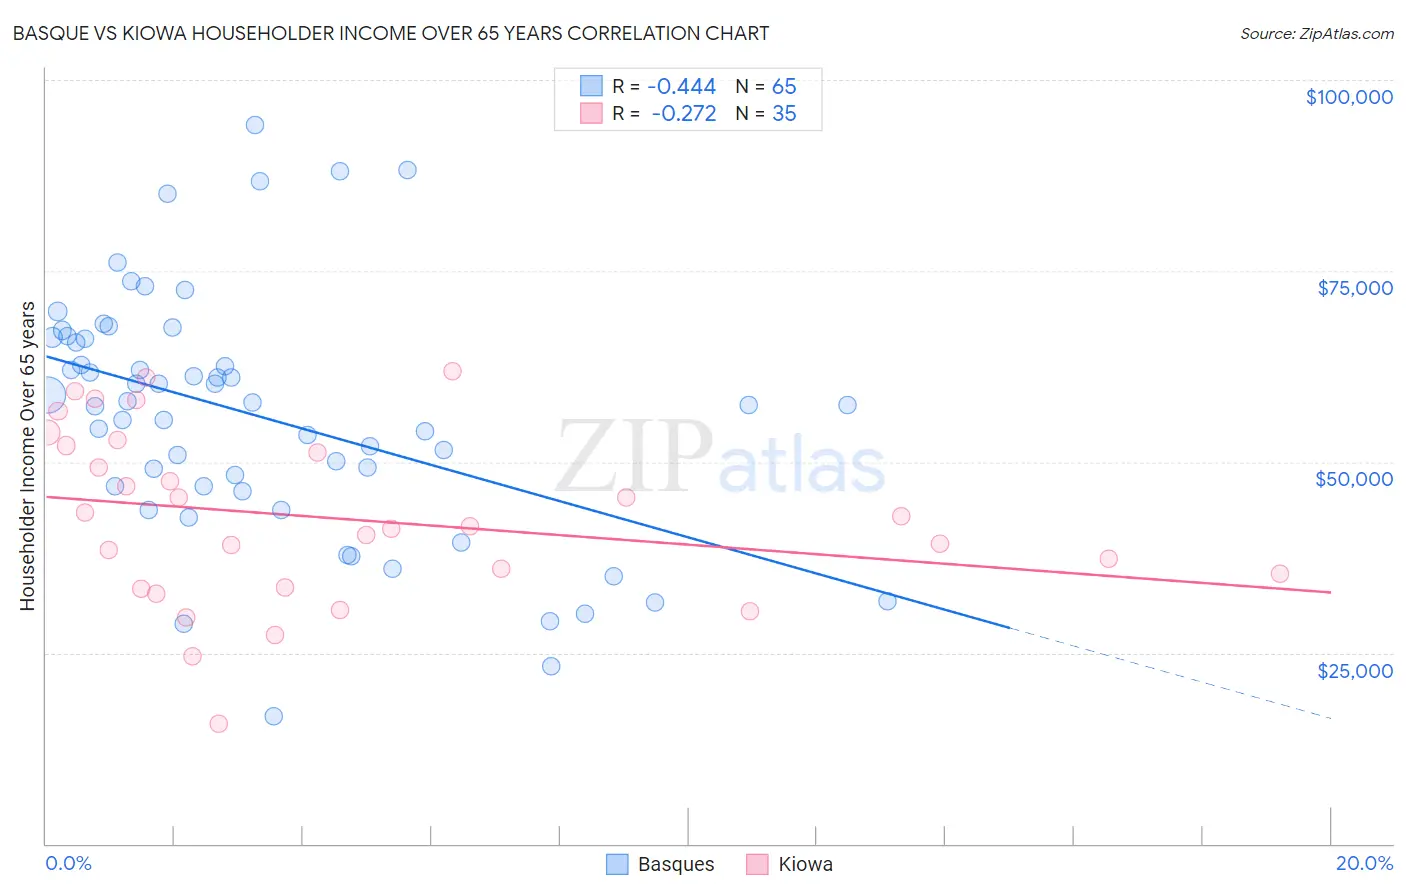
Basque vs Kiowa Householder Income Over 65 years Correlation Chart
The statistical analysis conducted on geographies consisting of 165,583,325 people shows a moderate negative correlation between the proportion of Basques and household income with householder over the age of 65 in the United States with a correlation coefficient (R) of -0.444 and weighted average of $62,653. Similarly, the statistical analysis conducted on geographies consisting of 56,056,100 people shows a weak negative correlation between the proportion of Kiowa and household income with householder over the age of 65 in the United States with a correlation coefficient (R) of -0.272 and weighted average of $51,140, a difference of 22.5%.
Householder Income Over 65 years Correlation Summary
| Measurement | Basque | Kiowa |
| Minimum | $16,667 | $15,714 |
| Maximum | $94,125 | $61,875 |
| Range | $77,458 | $46,161 |
| Mean | $55,918 | $42,635 |
| Median | $57,500 | $41,563 |
| Interquartile 25% (IQ1) | $46,469 | $33,542 |
| Interquartile 75% (IQ3) | $66,222 | $52,128 |
| Interquartile Range (IQR) | $19,753 | $18,586 |
| Standard Deviation (Sample) | $16,196 | $11,308 |
| Standard Deviation (Population) | $16,071 | $11,146 |
Similar Demographics by Householder Income Over 65 years
Demographics Similar to Basques by Householder Income Over 65 years
In terms of householder income over 65 years, the demographic groups most similar to Basques are Immigrants from Western Asia ($62,645, a difference of 0.010%), Immigrants from Eastern Europe ($62,693, a difference of 0.060%), Aleut ($62,708, a difference of 0.090%), Swedish ($62,736, a difference of 0.13%), and Immigrants from Germany ($62,544, a difference of 0.17%).
| Demographics | Rating | Rank | Householder Income Over 65 years |
| Tlingit-Haida | 88.6 /100 | #123 | Excellent $62,922 |
| Taiwanese | 88.3 /100 | #124 | Excellent $62,894 |
| Soviet Union | 87.8 /100 | #125 | Excellent $62,848 |
| Peruvians | 86.8 /100 | #126 | Excellent $62,766 |
| Swedes | 86.4 /100 | #127 | Excellent $62,736 |
| Aleuts | 86.1 /100 | #128 | Excellent $62,708 |
| Immigrants | Eastern Europe | 85.9 /100 | #129 | Excellent $62,693 |
| Basques | 85.4 /100 | #130 | Excellent $62,653 |
| Immigrants | Western Asia | 85.3 /100 | #131 | Excellent $62,645 |
| Immigrants | Germany | 83.9 /100 | #132 | Excellent $62,544 |
| Immigrants | Northern Africa | 83.6 /100 | #133 | Excellent $62,522 |
| Immigrants | Brazil | 81.2 /100 | #134 | Excellent $62,364 |
| Immigrants | Chile | 81.0 /100 | #135 | Excellent $62,354 |
| Alaskan Athabascans | 80.6 /100 | #136 | Excellent $62,330 |
| Immigrants | Syria | 80.2 /100 | #137 | Excellent $62,303 |
Demographics Similar to Kiowa by Householder Income Over 65 years
In terms of householder income over 65 years, the demographic groups most similar to Kiowa are Immigrants from Haiti ($51,219, a difference of 0.15%), Bahamian ($51,000, a difference of 0.28%), Hopi ($50,925, a difference of 0.42%), Immigrants from Congo ($51,393, a difference of 0.49%), and Cajun ($51,397, a difference of 0.50%).
| Demographics | Rating | Rank | Householder Income Over 65 years |
| Immigrants | Honduras | 0.0 /100 | #319 | Tragic $51,888 |
| Colville | 0.0 /100 | #320 | Tragic $51,739 |
| Menominee | 0.0 /100 | #321 | Tragic $51,719 |
| British West Indians | 0.0 /100 | #322 | Tragic $51,463 |
| Cajuns | 0.0 /100 | #323 | Tragic $51,397 |
| Immigrants | Congo | 0.0 /100 | #324 | Tragic $51,393 |
| Immigrants | Haiti | 0.0 /100 | #325 | Tragic $51,219 |
| Kiowa | 0.0 /100 | #326 | Tragic $51,140 |
| Bahamians | 0.0 /100 | #327 | Tragic $51,000 |
| Hopi | 0.0 /100 | #328 | Tragic $50,925 |
| Blacks/African Americans | 0.0 /100 | #329 | Tragic $50,779 |
| Immigrants | Grenada | 0.0 /100 | #330 | Tragic $50,747 |
| Pima | 0.0 /100 | #331 | Tragic $50,539 |
| Dutch West Indians | 0.0 /100 | #332 | Tragic $50,475 |
| Cape Verdeans | 0.0 /100 | #333 | Tragic $50,077 |