Jamaican vs Immigrants from Kenya Householder Income Over 65 years
COMPARE
Jamaican
Immigrants from Kenya
Householder Income Over 65 years
Householder Income Over 65 years Comparison
Jamaicans
Immigrants from Kenya
$54,560
HOUSEHOLDER INCOME OVER 65 YEARS
0.1/ 100
METRIC RATING
266th/ 347
METRIC RANK
$59,710
HOUSEHOLDER INCOME OVER 65 YEARS
21.1/ 100
METRIC RATING
197th/ 347
METRIC RANK
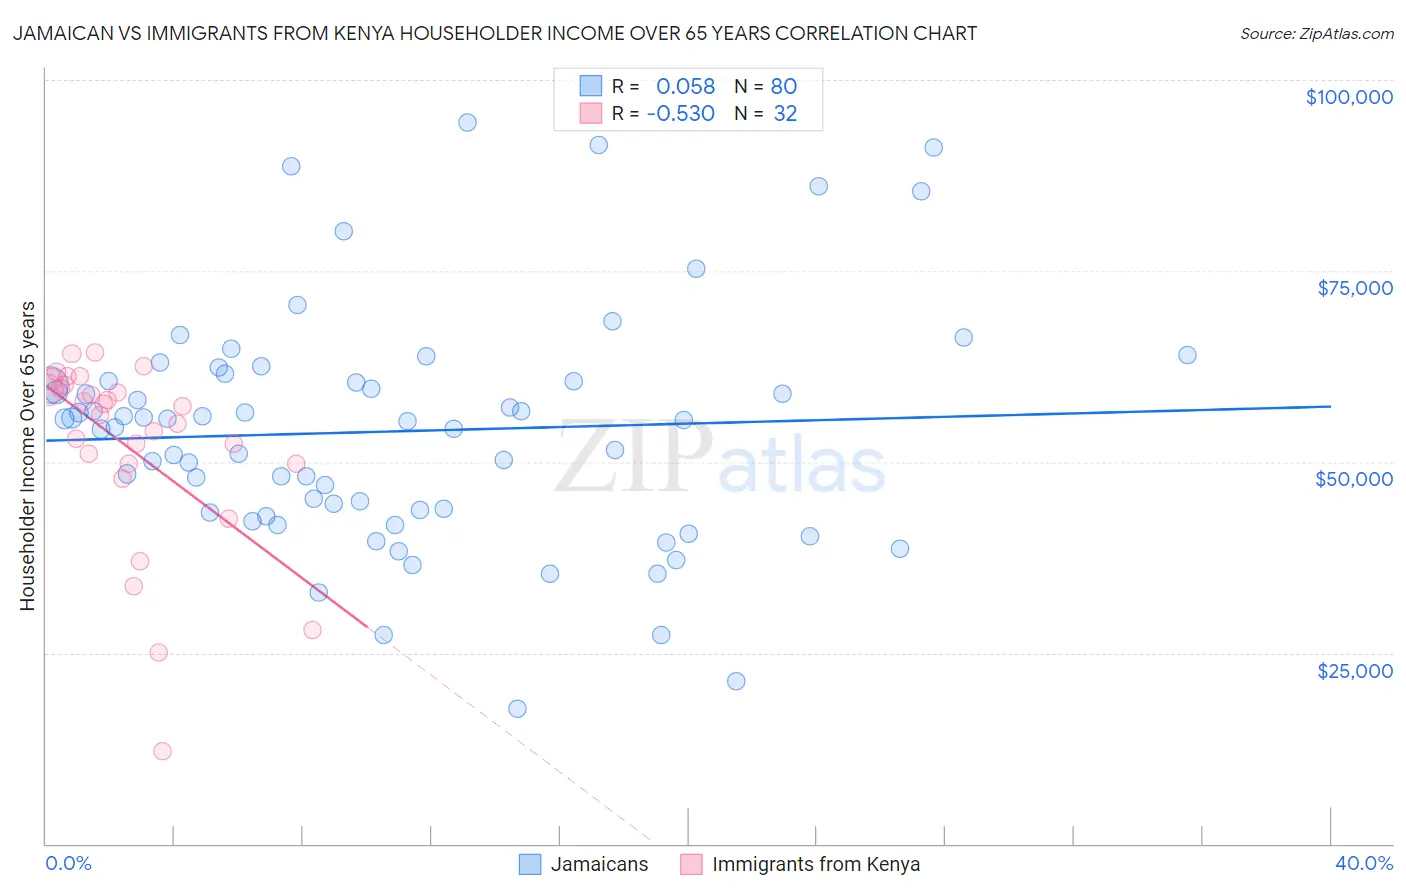
Jamaican vs Immigrants from Kenya Householder Income Over 65 years Correlation Chart
The statistical analysis conducted on geographies consisting of 366,342,723 people shows a slight positive correlation between the proportion of Jamaicans and household income with householder over the age of 65 in the United States with a correlation coefficient (R) of 0.058 and weighted average of $54,560. Similarly, the statistical analysis conducted on geographies consisting of 217,560,107 people shows a substantial negative correlation between the proportion of Immigrants from Kenya and household income with householder over the age of 65 in the United States with a correlation coefficient (R) of -0.530 and weighted average of $59,710, a difference of 9.4%.
Householder Income Over 65 years Correlation Summary
| Measurement | Jamaican | Immigrants from Kenya |
| Minimum | $17,596 | $12,049 |
| Maximum | $94,474 | $64,334 |
| Range | $76,878 | $52,285 |
| Mean | $53,994 | $51,985 |
| Median | $55,397 | $56,685 |
| Interquartile 25% (IQ1) | $43,595 | $49,767 |
| Interquartile 75% (IQ3) | $60,577 | $59,847 |
| Interquartile Range (IQR) | $16,982 | $10,080 |
| Standard Deviation (Sample) | $15,398 | $12,400 |
| Standard Deviation (Population) | $15,302 | $12,205 |
Similar Demographics by Householder Income Over 65 years
Demographics Similar to Jamaicans by Householder Income Over 65 years
In terms of householder income over 65 years, the demographic groups most similar to Jamaicans are Belizean ($54,580, a difference of 0.040%), Guatemalan ($54,526, a difference of 0.060%), Immigrants from Zaire ($54,512, a difference of 0.090%), Nicaraguan ($54,474, a difference of 0.16%), and Apache ($54,668, a difference of 0.20%).
| Demographics | Rating | Rank | Householder Income Over 65 years |
| West Indians | 0.2 /100 | #259 | Tragic $54,936 |
| Immigrants | West Indies | 0.2 /100 | #260 | Tragic $54,927 |
| Comanche | 0.2 /100 | #261 | Tragic $54,922 |
| Bangladeshis | 0.1 /100 | #262 | Tragic $54,719 |
| French American Indians | 0.1 /100 | #263 | Tragic $54,699 |
| Apache | 0.1 /100 | #264 | Tragic $54,668 |
| Belizeans | 0.1 /100 | #265 | Tragic $54,580 |
| Jamaicans | 0.1 /100 | #266 | Tragic $54,560 |
| Guatemalans | 0.1 /100 | #267 | Tragic $54,526 |
| Immigrants | Zaire | 0.1 /100 | #268 | Tragic $54,512 |
| Nicaraguans | 0.1 /100 | #269 | Tragic $54,474 |
| Immigrants | Senegal | 0.1 /100 | #270 | Tragic $54,447 |
| Liberians | 0.1 /100 | #271 | Tragic $54,356 |
| Potawatomi | 0.1 /100 | #272 | Tragic $54,212 |
| Indonesians | 0.1 /100 | #273 | Tragic $54,176 |
Demographics Similar to Immigrants from Kenya by Householder Income Over 65 years
In terms of householder income over 65 years, the demographic groups most similar to Immigrants from Kenya are German ($59,730, a difference of 0.030%), Moroccan ($59,683, a difference of 0.040%), Immigrants ($59,656, a difference of 0.090%), French ($59,656, a difference of 0.090%), and Immigrants from Iraq ($59,824, a difference of 0.19%).
| Demographics | Rating | Rank | Householder Income Over 65 years |
| Puget Sound Salish | 25.3 /100 | #190 | Fair $59,934 |
| Belgians | 24.9 /100 | #191 | Fair $59,915 |
| South Americans | 23.8 /100 | #192 | Fair $59,854 |
| Immigrants | Costa Rica | 23.6 /100 | #193 | Fair $59,848 |
| Immigrants | Africa | 23.4 /100 | #194 | Fair $59,837 |
| Immigrants | Iraq | 23.2 /100 | #195 | Fair $59,824 |
| Germans | 21.5 /100 | #196 | Fair $59,730 |
| Immigrants | Kenya | 21.1 /100 | #197 | Fair $59,710 |
| Moroccans | 20.7 /100 | #198 | Fair $59,683 |
| Immigrants | Immigrants | 20.2 /100 | #199 | Fair $59,656 |
| French | 20.2 /100 | #200 | Fair $59,656 |
| Dutch | 18.3 /100 | #201 | Poor $59,539 |
| Finns | 18.2 /100 | #202 | Poor $59,535 |
| Scotch-Irish | 16.9 /100 | #203 | Poor $59,447 |
| Arapaho | 16.0 /100 | #204 | Poor $59,383 |